Cover and narrative setup


Deck preview
This template does not have a dedicated before/after case study, so we show the strongest slides from the actual deck instead.
Cover and narrative setup
Core structure and talking points
Polished visual slide from the deck
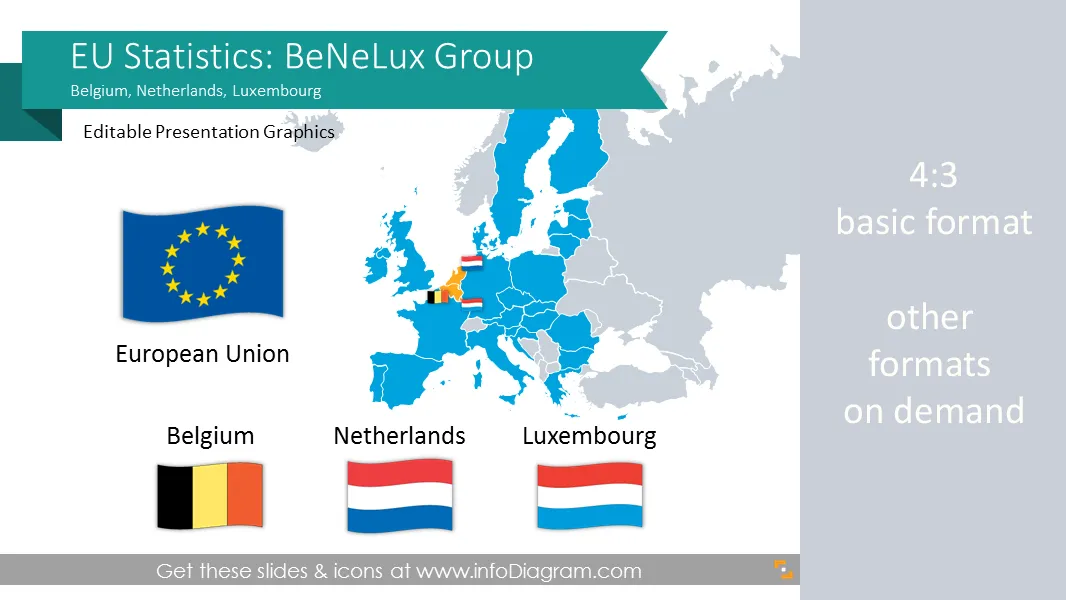
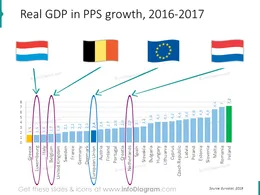
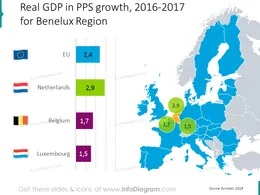
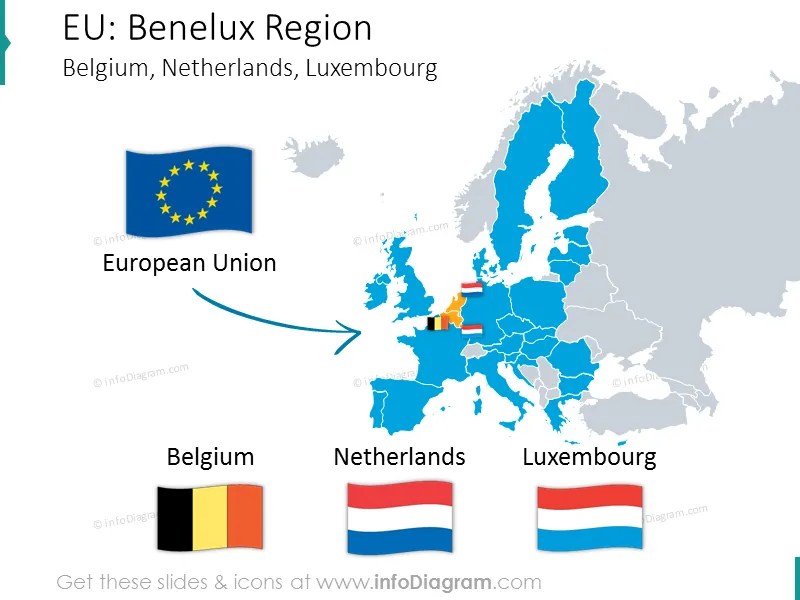
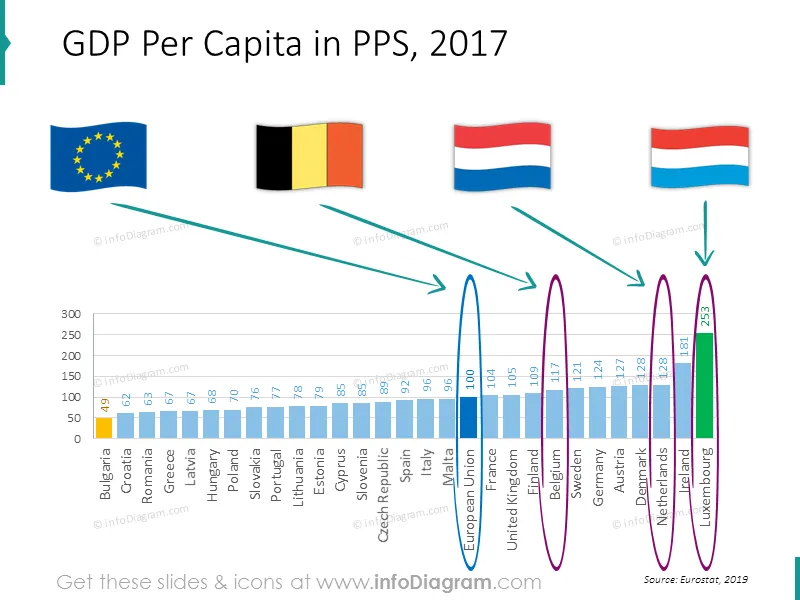
Belgium Netherlands Luxembourg (Benelux) editable visualizations of main macroeconomic statistics
Comparing European Union average with Benelux Europe countries (based on official Eurostat data)
Basic country data:
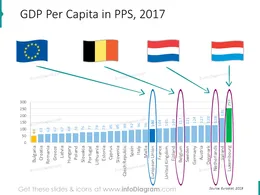
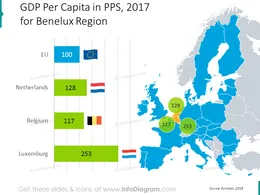
Economy data:
Fully editable vector shapes by using built-in PowerPoint tools, including
See editing demonstration in our HowTo Videos.
Sus gráficos añaden un toque agradable a mis presentaciones y recientemente los usé para una de mis reuniones generales. Su conjunto de herramientas añade profesionalismo a mis diapositivas. En lugar de usar imágenes prediseñadas estándar.
Claude Jones, Director of Engineer, @Walmartlabs, USA
Necesitaba un aspecto fresco para algunas de mis diapositivas. Había intentado encontrar una forma de crear un efecto de pincel, de subrayar, acentuar, añadir algo de color y los marcadores escritos a mano fueron justo lo que necesitaba. Muy fácil de usar, fácil de ajustar el tamaño, cambiar el color. Fue una solución asequible y perfecta, y estoy feliz de recomendarla.
Anonymous, US
El aspecto nítido y limpio de los gráficos, y el hecho de que me permitiera editar y cambiar fácilmente los colores para que coincidieran con la plantilla fue mi principal razón para comprarlos.
Brandie Jenkins, Desarrollador de e-learning, USA


You may also need