Cover and narrative setup
Usage example
Deck preview
What the deck looks like in practice
This template does not have a dedicated before/after case study, so we show the strongest slides from the actual deck instead.
Cover and narrative setup
Core structure and talking points
Polished visual slide from the deck
Description
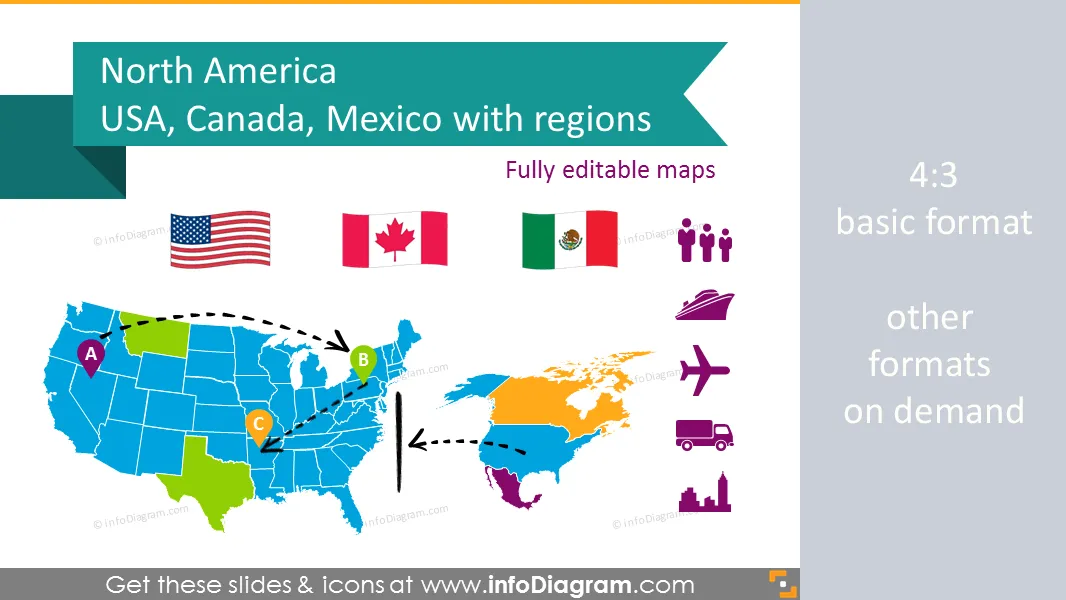
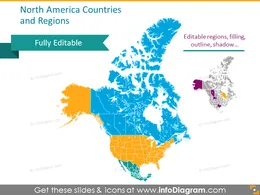
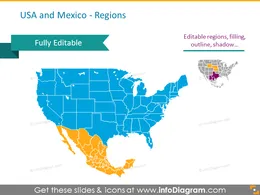
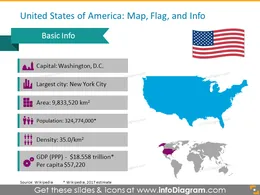
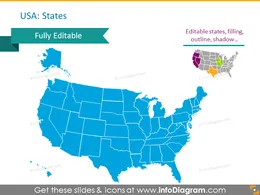
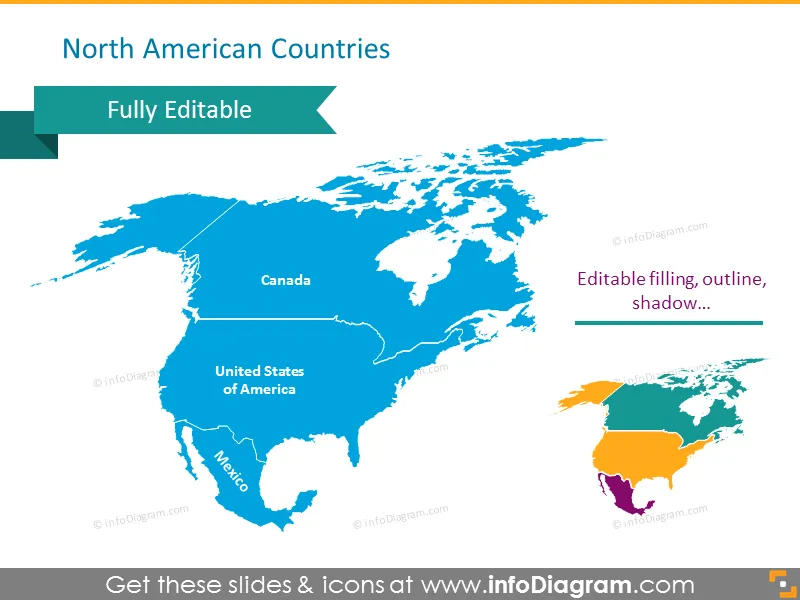
US and Canada administrative territories (US states, Canada provinces). Map includes North America editable PowerPoint graphics, localization and transport icons and country statistics. Additionaly map of USA and Mexico.
- Map of Canada and US and Mexico.
- Maps of US states, countries, world
- Flags of USA, Canada, Mexico
- Localization icons: places, hand drawn arrows
- Data icons: population, density, GDP, capital, transport, production, distribution
- Fully editable maps, icons, arrows
- Canada territories including: Newfoundland and Labrador, Nova Scotia, British Columbia
- Coastlines: Pacific Oecan, Gulf of Mexico, Atlantic Ocean
Content
Set of vector maps editable in PowerPoint of North America (excluded Central America - see the other package)
- United States of America map with states, US flag
- Canada map, Canadian flag
- Mexico map, Mexican flag
- Map of North America continent
- Country statistics data: Population, Density, Area, GDP, Largest city, Capital
- World map with North America highlighted
Icons for showing localization and logistics on maps:
- Pins and flags for indicating a place
- Handdrawn arrows for showing routes and journeys
- Transportation icons: Truck, Train, Plane, Ship, Bus, Lorry for illustrating logistic routes on the America map
- Production pictograms: Factory icon, Production facility icon, Production gears icon
- Distribution pictograms: Distribution centre icon, Wholesale icon, Consumption Retail shop icon
- City pictogram: Capital icon, Big city icon
Examples of PowerPoint maps visualization:
- Places pins and indicating time zone
- Routes from point A to point B and C in the US states (as handwritten arrows on a US map)
- Transportation routes: flights and trains between the US states
- Production and distribution routes from Mexico factory to US distribution centers and US retail shops
- Distribution pictograms: Distribution centre icon, Wholesale icon, Consumption Retail shop icon
Further information sources on countries data
- United States of America (Wikipedia)
- Canada ( Wikipedia )
- Mexico ( Wikipedia )
- North America (Wikipedia)
- Countries list by GDP ( Wikipedia )
- GDP comparisons by World Bank, International Monetary Fund, CIA World Factbook ( Wikipedia )
- The World Factbook 2009. Washington, DC: Central Intelligence Agency ( CIA Factbook )
Acronyms used
- GDP – Gross Domestic Product
- PPP - Purchasing Power Parity
- sq mi – square mile
- km2 – square kilometer
Editable elements
Fully editable vector shapes by using built-in PowerPoint tools, including
- editing texts
- editing maps (color of the fill and outline, style - gradient, with outline, shadow, reflection)
- arrows and icon pictograms: changing fill color, size, style (gradient fill, outline, shadow, reflection)
- all elements are transparent (charts, maps, flags, arrows), you can put them behind or above your content
See editing demonstration in our HowTo Videos.
Author
- InfoDiagram contributor & Prezentio.com designers
- Contact: infoDiagram
Slides included in this PowerPoint Presentation:
- North America Map Blank: USA, Canada, Mexico
- North America Map With Regions
- USA and Mexico maps detailed
- Unites States of America Overview: capital, largest city, area, population, density and GDP
- Vector Map of US States
- Canada Overview: capital, largest city, area, population, density and GDP
- Map of Canada Provinces and Administrative Regions
- Information of Mexico: capital, largest city, area, population, density and GDP
- Detailed Map of Mexico with Administrative Regions
- Political Map of North American Countries
- World Map with North American Countries Highlited
- World Map continents vector shapes
- World Map Image continents
- Location icons: pin, place, city, person, capital, flag
- Icons of Population, Area, Time, Population Density
- Transport Symbols: car, truck, train, plane, ship
- Production facilities: plant, manufacture, city with factories
- Distribution and Retail Symbols: distribution centre, wholesale, retail shop, consumption
- Direction and Distance Arrows in hand drawn ink style
- Map of USA states with Pin and time zones
- Transport routes of USA: Path from point A to B
- Supply Lines Drawing on US map
- North American Map with Manufacturing Facilities: Production and Distribution
Reviews
Vos graphiques ajoutent une belle touche à mes présentations et je les ai récemment utilisés pour l'une de mes réunions générales. Votre boîte à outils ajoute du professionnalisme à mes diapositives. Au lieu d'utiliser des cliparts standards.
Claude Jones, Directeur de l'ingénierie, @Walmartlabs, USA
J'avais besoin d'un nouveau regard sur certaines de mes diapositives. J'ai essayé de trouver un moyen de créer un effet de pinceau, de souligner, d'accentuer, d'ajouter de la couleur et les marqueurs manuscrits étaient exactement ce qu'il fallait. Très facile à utiliser, facile à ajuster la taille, à changer la couleur. C'était une solution abordable et parfaite et je suis heureux de la recommander.
Anonymous, US
L'aspect net et épuré des graphiques, et le fait qu'il m'ait permis d'éditer et de changer facilement les couleurs pour les adapter au modèle, ont été les principales raisons de mon achat.
Brandie Jenkins, Développeur E-learning, USA
How to Edit
How to edit text & colors

How to expand / shorten diagram

How to Replace Icons in infoDiagram PPT

You may also need