Financial Decks
Visualize your results with ease
Business Units Performance KPIs Dashboard
from deck
Monthly Business Report with Financial Performance Review (PowerPoint Template)
Info
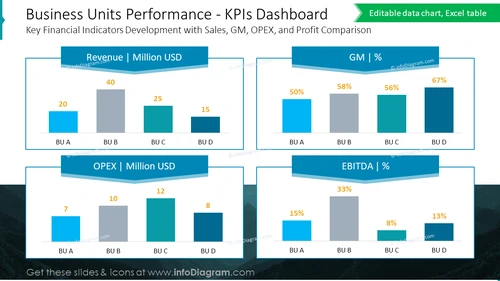
Business Units Performance - KPIs Dashboard
Slide Content
The slide presents a dashboard of key financial indicators for business unit performance comparison, including Revenue in million USD, GM (Gross Margin) as a percentage, OPEX (Operating Expenses) in million USD, and EBITDA (Earnings Before Interest, Taxes, Depreciation, and Amortization) as a percentage. There are four business units (BU A, B, C, and D) compared across these metrics. Revenue indicates the total sales generated by each unit. GM reflects the profitability relative to sales. OPEX represents the costs of running the business, excluding costs of goods sold. EBITDA demonstrates the company's earnings prior to interest, taxes, depreciation, and amortization expenses.
Graphical Look
- The slide has a dark teal background with lighter shades and white text for contrast.
- There are four sets of bar charts, each labeled with a financial indicator ('Revenue', 'GM', 'OPEX', 'EBITDA').
- Each bar chart has four vertical bars representing different business units (BU A, BU B, BU C, BU D).
- The bars are colored in gradients of blue and gray, with blue indicating the actual value and gray likely representing a benchmark or target.
- Data values are displayed at the top of each bar for clarity.
- There are light teal banner titles for each chart, enhancing visual segmentation.
- The slide uses sans-serif fonts for a modern, clean look.
The slide has a cohesive and professional design with a clear visual hierarchy that makes it easy to read and understand. The use of color not only distinguishes between different units but also provides a visual cue for benchmarking or target comparison.
Use Cases
- Presenting financial results and performance metrics to stakeholders or investors in quarterly or annual business reviews.
- Comparing performance across business units in internal strategy meetings or business operations reviews.
- Visualization in management discussions for budget allocation or financial planning.
- Utilized as part of a dashboard in financial or executive presentations to provide an at-a-glance performance assessment.


