Financial Decks
Visualize your results with ease
Cash Flow Margin Development
from deck
Monthly Business Report with Financial Performance Review (PowerPoint Template)
Info
Cash Flow Margin Development
Slide Content
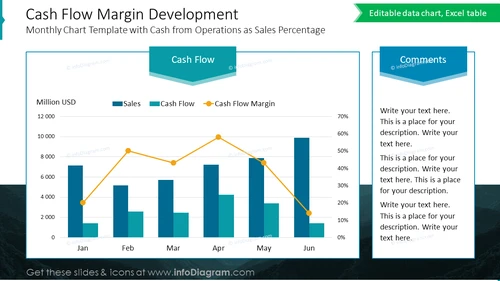
The PowerPoint slide titled "Cash Flow Margin Development" provides a graphical representation of the monthly chart template with cash from operations as a sales percentage. It charts two key financial metrics: Sales and Cash Flow, represented as bars, and Cash Flow Margin, shown as a line graph. The Cash Flow Margin is depicted in percentage and tracks the profitability performance relative to sales over a six-month period, from January to June. Each concept clarifies a specific financial aspect: "Sales" defines the total revenue, "Cash Flow" indicates the net amount of cash being transferred into and out of a business, and "Cash Flow Margin" measures how many cents of cash flow are generated for each dollar of sales.
Graphical Look
- The slide background is white with a blue-green header that includes the title.
- There are two main graphical elements, a bar chart and a line graph overlay.
- The bar chart uses dark and light blue to differentiate between Sales and Cash Flow.
- The line chart, depicting Cash Flow Margin, is orange with circular data point markers.
- A legend explaining the color coding of the data series is positioned in the lower-left corner.
- Two text boxes with teal headers, labeled 'Cash Flow' and 'Comments,' are on the right, containing placeholder text.
- The font color is predominantly dark blue, maintaining readability and contrast.
The slide is professionally designed with a clean and straightforward layout, highly focused on showcasing data. The use of color is consistent and aids in differentiating between the different data presentations.
Use Cases
- Presenting monthly financial performance in a management or shareholder meeting.
- Offering a visual overview of financial health during a business review or audit presentation.
- Showcasing a company's cash efficiency in investor pitch decks to illustrate financial management.
- Evaluating and discussing trends in financial metrics during a strategic planning session.


