Financial Decks
Visualize your results with ease
Main Business Lines Profit Drivers MBR
from deck
Monthly Business Report with Financial Performance Review (PowerPoint Template)
Info
Main Business Lines Profit Drivers Analysis
Slide Content
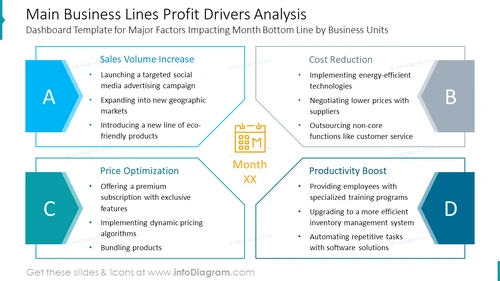
The PowerPoint slide is titled "Main Business Lines Profit Drivers Analysis," and discusses four key strategies for impacting the bottom line of business units on a monthly basis. These strategies include:
-
Sales Volume Increase: This involves launching a targeted social media campaign, expanding into new markets, and introducing eco-friendly products, each of which can help to increase the volume of sales.
-
Cost Reduction: By implementing energy-efficient technologies, negotiating with suppliers for lower prices, and outsourcing non-essential functions, a company aims to reduce its operating costs.
-
Price Optimization: This tactic includes offering premium subscriptions, implementing dynamic pricing algorithms, and bundling products to maximize revenue from existing sales.
-
Productivity Boost: The strategy focuses on improving employee performance through specialized training, upgrading systems like inventory management to be more efficient, and automating repetitive tasks to save time.
Graphical Look
- Slide background color is white.
- A central, orange calendar icon with "Month XX" below it creates a focal point of the slide.
- Four corner sections labeled A, B, C, and D, each with a different shade of blue and an overlaid lighter blue shape creating a 3D effect.
- Each section contains a white box with a title in black text and bullet points below in a smaller font.
- Connectors in the form of blue lines radiate from the central icon to the four sections, creating a sense that these areas are linked to the central concept of monthly analysis.
The overall look of the slide is clean and modern, with a professional layout that employs contrasting shades of blue to distinguish different content areas. The central calendar icon successfully anchors the viewer's attention to the concept of monthly analysis.
Use Cases
- To present performance improvement plans in management meetings.
- During strategy sessions to identify and discuss key areas of potential profit growth.
- In financial reviews to showcase how various business units are contributing to profit increases ```markdown
Main Business Lines Profit Drivers Analysis
Slide Content
The PowerPoint slide is titled "Main Business Lines Profit Drivers Analysis," indicating a focus on evaluating various factors that influence the profitability of business segments. It elaborates on critical strategies for enhancing profitability across different business units:
- Sales Volume Increase: It signifies efforts to boost revenue through specific marketing campaigns, market expansion, and product line diversification.
- Cost Reduction: This implies initiatives aimed at decreasing operational expenses through energy efficiency, supplier negotiations, and outsourcing.
- Price Optimization: This includes tactics to maximize profits by refining pricing strategies, such as exclusive offerings and dynamic pricing.
- Productivity Boost: It refers to measures designed to improve workforce efficiency and operational processes via training, system enhancements, and task automation.
Graphical Look
- The slide's background is plain white.
- A central illustration features an orange calendar icon labeled "Month XX," signifying a focal point for the timeframe of the profit analysis.
- Around the central icon are four quadrants colored in different shades of blue, designated with the letters A, B, C, and D, with a 3D appearance due to overlaying shapes.
- Each quadrant contains a text box with a strategy title and descriptive bullet points in a contrasting white background.
- Blue lines connect the central icon to the quadrants, implying the interconnectivity of these strategies and their collective impact on the monthly profit analysis.
The slide's design is sharp and corporate, with a structured layout that effectively segments the content into distinct strategies, using color contrasts to facilitate comprehension. The central icon works as an anchor, tying the strategies together with the concept of monthly business evaluation.
Use Cases
- Presenting strategic business performance objectives during executive briefings or board meetings.
- Conducting a strategic analysis or review of business units with mid-level managers.
- Identifying areas for financial improvement during annual planning or budgeting workshops.
- Communicating company-wide cost-saving or revenue-enh ## Main Business Lines Profit Drivers Analysis
Slide Content
The PowerPoint slide is titled "Main Business Lines Profit Drivers Analysis," and provides insights into strategies that impact the monthly bottom line of business units. The slide outlines four major strategies:
- Sales Volume Increase: Strategies like launching targeted advertising campaigns, exploring new geographic markets, and introducing eco-friendly product lines can contribute to increasing sales volume, which is a direct factor in profit generation.
- Cost Reduction: Efforts such as adopting energy-efficient technologies, securing lower prices from suppliers, or outsourcing customer service are designed to decrease overhead costs and improve profit margins.
- Price Optimization: Techniques such as offering a premium subscription with unique features, using dynamic pricing algorithms, and product bundling are employed to maximize revenue and optimize the pricing aspect of the business.
- Productivity Boost: Boosting productivity through specialized employee training, upgrading to a more efficient inventory management system, and leveraging software to automate tasks, all aim at enhancing efficiency and lowering operational costs.
Graphical Look
- The slide has a white background, providing a clean and neutral canvas for the content.
- Four overlapping, staggered corner tabs or bookmarks, each labeled with a capital letter from A to D, represent four business strategies. They are filled with different shades of blue, suggesting a categorization.
- Each tab includes a keynote box with a white background containing the relevant strategy name in bold and a bullet list of initiatives related to that strategy.
- A central calendar-like icon colored orange with the placeholder text "Month XX" serves as the focal point, connecting the four strategies via blue lines suggesting their relationship to the time period in question.
- The slide possesses a balanced composition with a harmonious color scheme and strategic use of space, placing equal visual emphasis on each business strategy.
The slide is professionally designed, with a crisp and clear layout that facilitates easy comprehension of the presented strategies. The use of shades of blue adds visual variety and helps to differentiate between the quarters of ```markdown
Main Business Lines Profit Drivers Analysis
Slide Content
The slide, titled "Main Business Lines Profit Drivers Analysis," details strategic approaches for improving profitability divided among four categories:
-
Sales Volume Increase: This includes initiatives such as targeted social media campaigns, geographic market expansion, and the introduction of eco-friendly products, aimed at boosting the quantity of products or services sold.
-
Cost Reduction: This addresses implementing energy-efficient measures, negotiating better prices with suppliers, and outsourcing non-essential services to reduce overall expenditure.
-
Price Optimization: Strategies here involve adopting exclusive subscription offers, applying dynamic pricing models, and creating product bundles to enhance revenue gained from sales.
-
Productivity Boost: Here, the focus is on providing specialized training, improving inventory management systems, and automating routine tasks to increase effectiveness and efficiency.
Graphical Look
- The slide features a white background, offering a clean and uncluttered visual field.
- It includes a central orange calendar icon with "Month XX" inscribed below it, serving as the core of the slide layout.
- Four colored corner labels marked A, B, C, and D, each with a layered blue tone and a 3D accent, are positioned in a clockwise arrangement from the top left.
- Each corner label contains a corresponding text box with a white backing, listing individual strategies and actions in bulleted form.
- Blue lines connect the central calendar icon to the corner labels, indicating the intertwining of the strategies around the central time-oriented theme.
The slide's composition is characterized by a clean, professional aesthetic, using a contrast of blue tones and simple geometric shapes to structure information effectively.
Use Cases
- Utilizing the slide to outline key profit-driving strategies during corporate strategy meetings or workshops.
- Explaining how various departments can contribute to the overall profitability in internal quarterly business reviews.
- Facilitating discussions around operational improvements in management training or leadership development programs.
- Presenting to investors or stakeholders to ```markdown
Main Business Lines Profit Drivers Analysis
Slide Content
The slide, titled "Main Business Lines Profit Drivers Analysis," provides a clear framework to assess the profit-driving factors within a company, focusing on four key business areas:
-
Sales Volume Increase: Techniques to grow sales figures such as deploying targeted marketing strategies, penetrating new markets, and launching new environmentally friendly lines.
-
Cost Reduction: Measures targeted at overhead reduction like the adoption of more energy-efficient technologies, better procurement deals, and outsourcing of non-critical functions.
-
Price Optimization: Methods to enhance revenue through pricing strategies, offering exclusive product tiers, dynamic pricing, and bundling for added value.
-
Productivity Boost: Strategies to raise efficiency and cut costs through targeted employee training, system upgrades for better inventory management, and the automation of routine tasks.
Graphical Look
-
The slide background is uniformly white, emphasizing the content and aiding readability.
-
Centrally, there's an orange calendar icon with "Month XX" suggesting a focus on a specific period for the analysis.
-
Four blue tabs labeled A to D are positioned around the slide's margins, with overlays giving a 3D look, representing different strategies.
-
Inside each tab, there's a white-background textbox detailing each strategy with bullet points in a concise format.
-
Solid blue lines link the central calendar icon with each of the four surrounding shapes, creating a visual connection between the central theme and each strategy.
The slide has a clean and professional appearance, with a color palette of blues and orange that divides the content into easily distinguishable sections. The central icon acts as an anchor, bringing together the various components for a cohesive presentation.
Use Cases
-
To demonstrate strategic growth initiatives in a boardroom presentation.
-
For illustrating cost-saving and profit-maximization strategies during a financial review meeting.
-
As a teaching tool in business and management courses focusing on profit maximization.
-
```markdown
Main Business Lines Profit Drivers Analysis
Slide Content
The PowerPoint slide titled "Main Business Lines Profit Drivers Analysis" delves into the various strategies that can influence the profitability of different segments within a business. The strategies are classified into four categories that are pivotal for increasing profits:
- Sales Volume Increase: Enhancing sales by tapping into targeted marketing, new markets, and introducing eco-friendly goods.
- Cost Reduction: Decreasing operational expenses through efficiency technology, improved supplier negotiations, and outsourcing.
- Price Optimization: Adjusting pricing models through exclusive offers, dynamic pricing, and bundling to maximize profit margins.
- Productivity Boost: Augmenting productivity via specialized training, system enhancement, and task automation to streamline operations.
Graphical Look
- White background providing a neutral and distraction-free canvas.
- A prominently centered orange calendar icon with "Month XX" situates the timeline for analysis.
- Die-cut style tabs, colored in progressive shades of blue and labeled A through D, denote the four strategic business areas.
- Each tab encloses a white text box that highlights key points related to the respective business strategy in bullet-point format.
- Interconnecting blue lines graphically link the central calendar icon to the four tabs, underscoring the concerted impact of these strategies on the monthly profit analysis.
The slide's design boasts a professional, crisp aesthetic that employs a logical layout and contrasting colors to clearly communicate complex strategies. The central icon smartly intertwines the elements, emphasizing the temporal aspect of the analysis.
Use Cases
- Presenting monthly performance and strategic initiatives during corporate meetings.
- Explaining key profit drivers to stakeholders in investor relations pitches.
- Educating management teams on profit optimization strategies during training sessions.
- Discussing cost-reduction and efficiency improvement during operational review gatherings. ```


