Financial Decks
Visualize your results with ease
Monthly Profit Loss Data Presentation
from deck
Monthly Business Report with Financial Performance Review (PowerPoint Template)
Info
Monthly Profit and Loss Data Presentation
Slide Content
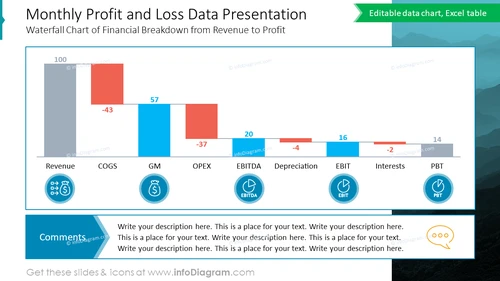
This PowerPoint slide showcases a Waterfall Chart of Financial Breakdown from Revenue to Profit, demonstrating a company’s monthly profit and loss data. The chart includes numerical values for Revenue, COGS (Cost of Goods Sold), GM (Gross Margin), OPEX (Operating Expenses), EBITDA (Earnings Before Interest, Taxes, Depreciation, and Amortization), Depreciation, EBIT (Earnings Before Interest and Taxes), Interests, and PBT (Profit Before Tax).
- Revenue: Starting point for financial calculations (100)
- COGS: Costs directly tied to production (-43)
- GM: Sales revenue minus production costs (57)
- OPEX: Operating expenses that are not tied to production (-37)
- EBITDA: Operating profit with non-cash expenses added back (+20)
- Depreciation: Allocation of the cost of assets over their useful life (-4)
- EBIT: Operating income after depreciation (+16)
- Interests: Cost of borrowing funds (-2)
- PBT: Earnings before tax is calculated (14)
Graphical Look
- The slide title is prominently displayed in large, bold text at the top.
- An aqua green ribbon on the top right corner labels the chart as "Editable data chart, Excel table."
- A Waterfall Chart is centrally placed, showing a sequence of rectangles that help visualize the step-by-step journey from Revenue to Profit.
- Each stage of the chart is labeled with a corresponding acronym beneath it, and each stage is represented by a different color. Positive values are in shades of blue, while negative values are in red.
- Below the chart, circular icons with corresponding financial abbreviations (e.g., EBITDA, EBIT, PBT) are placed.
- A comment box in aqua blue stretches across the bottom with a placeholder for additional text.
- A speech bubble icon with three ellipses is positioned near the bottom right, indicating a section for audience interaction or feedback.
The overall look of the slide is clean and professional, with a clear emphasis on the Waterfall Chart. The color scheme aids in distinguishing between positive and negative financial figures, and the use of icons helps to visually encapsulate the financial terms.
Use Cases
- Presenting financial results in a corporate meeting to provide a visual breakdown of profit and loss elements.
- Illustrating step-by-step financial performance to investors during a shareholder presentation.
- Teaching or explaining the components of a company's income statement in a business or accounting class.
- Assessing financial health during a fiscal year-end review with key stakeholders or an internal team.


