Financial Decks
Visualize your results with ease
Outline key shape graphics with icons for six items
from deck
Outline Diagrams - Ultimate Deck for Visual Presentations (PPT graphics)
Info
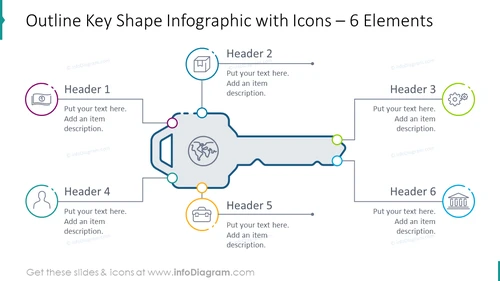
Outline Key Shape Infographic with Icons – 6 Elements
Slide Content
This PowerPoint slide, titled "Outline Key Shape Infographic with Icons – 6 Elements," is designed to present a series of six related topics or ideas. Each element has a unique icon and a space for a header and descriptive text, suggesting a step-by-step or interconnected relationship. The 'Key' shape connecting the icons can imply a progressive flow or critical steps in a process, with each item representing a significant part or stage within a larger scheme.
Graphical Look
- The central graphic is a stylized outline of a key, executed in a bold blue line.
- Each of the six elements is represented by a circular node connected to the key outline by a thin line.
- Each node has its own unique icon within a circle, with a different pastel colored highlight (purple, dark blue, green, light green, orange, and light blue).
- The circles have drop shadows adding depth to the graphics.
- Connecting lines include small circular bullets in various colors that correspond to the colors of the icons, creating visual consistency.
- Text placeholders adjacent to each node are provided for a header and additional description.
- The font used for the headers is bold and dark, enhancing readability against the light background.
The overall look of the slide is modern, clean, and balanced with a use of simple colors and shapes. The key graphic serves as the central focal point, guiding the viewer's eyes across the slide and connecting the elements cohesively.
Use Cases
- To outline the steps or components of a business strategy or process.
- As an agenda slide to introduce multiple topics or sessions of a workshop or seminar.
- To visualize the features or benefits of a product or service in a marketing presentation.
- To map out the phases of a project, indicating the sequence and importance of each phase.


