- Reviews
- Usage example
- Description
- How To Edit
Slides
Reviews
Usage example
Description
Do you need to present a comprehensive and easy-to-follow action plan that outlines the steps necessary to succeed in a new market? Use our Go to market Strategy deck including a variety of aspects that should be considered while entering a new market.
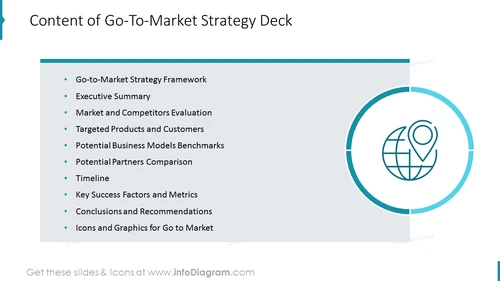
This Go To Market strategy template contains visual slides with:
- 27 diagram slides to illustrate Go to Market strategy framework, market evaluation and dashboards, competitive analysis, financial highlights, and more.
- To ensure a professional look, the presentation is designed in an elegant outline graphics style.
- 97 modern financial icons to express various topic-related concepts e.g. distribution, finance, retail, strategy, status, and charts.
- Instruction on how to modify those diagrams using standard PowerPoint editing tools.
Format: fully editable vector shapes (modify colors of diagrams and icons, resize without quality loss).
Authors of this Go-To-Market strategy presentation template
- Content advisory by Katarzyna Podlejska, Senior Consultant
Contact: Katarzyna’s LinkedIn profile - Design by infoDiagram designer.
Contact: here
What is Go to Market Strategy?
A go-to-market strategy is a tactical action plan that outlines the steps necessary to succeed in a new market or with a new customer. It can apply to pretty much anything, from service or product launch to re-launching your company or brand or even moving a current product into a new market.
Why use the Go to Market Strategy Template with Presentation Visuals?
If you need to convince the management board, investors, or any other stakeholders to enter the new marketplace Go-to-market Strategy is a good tool that can be used and shared across your entire company. Like any plan, it covers a lot of information in a short, concise manner.
Use our templates that will help you to present your vision in an eye-catching and attractive format. You can reuse our graphs and charts and tailor them to your needs to upgrade your presentation slides. The majority of our charts are Data-Driven Excel Charts, so it is very easy to change the presented values. We also include detailed instructions on how to alter the content, values, colors, and look and feel of the charts.
Where can you use Go-to-Market PPT Template Elements?
Using infographics in your presentation will help you organize information in a good-looking way and compellingly present your ideas, easy to understand by your audience.
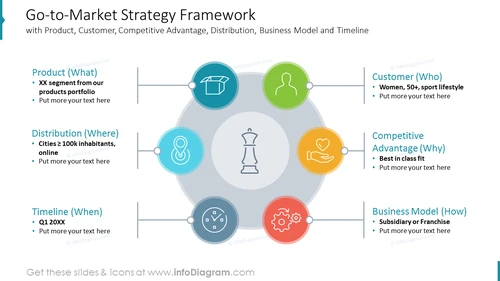
- Design a framework of your winning go-to-market strategy presenting all important elements on one slide
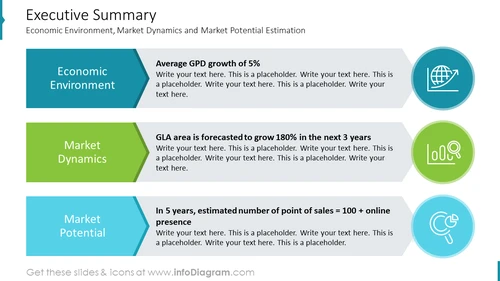
- Prepare executive summary with key message statements you want to convey
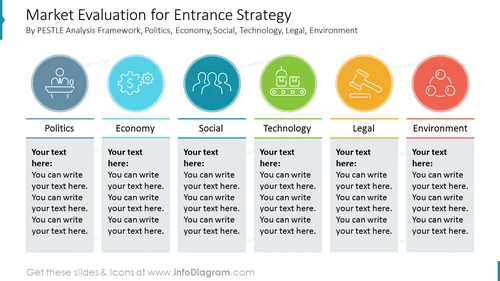
- Conduct market evaluation using the PESTLE analysis model
- Illustrate total available, serviceable available, and obtainable market volume
- Describe the competitive landscape comparing the biggest market players
- List key retail destinations of the new marketplace
- Conduct a SWOT analysis of the market you are to enter listing strengths, weaknesses, threats, and opportunities
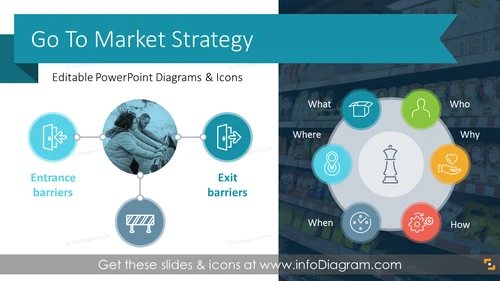
- Show entrance and exit barriers
- Present your targeted product portfolio including such elements as segment, price level, distribution channel to be used, and potential BTL promotion activities
- Visualize your targeted customer profile with an emphasis on special characteristics like personality, purchasing behavior, demographics, etc.
- Described your desired and optimal business model
- Compare potential market entrance model based on equity by conducting pros and cons analysis
- Present financial highlights of your business case benchmarking network development, revenue, and profitability in the timeline of 5 years adding relevant comments in pre-designed boxes
- Create a partnership maturity evaluation matrix allowing to compare potential partners with each other
- Compare considered partners bearing in mind their background, key strengths, current brand portfolio, and financial situation
- Present preferred partner by showing its achievements, customers' portfolio, management, and key financial indicators
- Visualize future organization structure comparing the subsidiary model with the distributor one
- Illustrate key milestones using a timeline of a rollout to the new marketplace
- Describe the key success factor of your expansion strategy
- Set your success metrics and elaborate on their relevance in a pre-design comments box
- Summarize your go-to-market strategy by presenting key conclusions, and next steps recommendations
Try using those PowerPoint illustrations to present your content visually in an elegant way.
All graphics are editable, so you can modify the colors and text. We also added a general icon collection at the end of the presentation deck. Optionally you can also extend the collection by more PPT symbols (see Related Diagrams section).
Fully editable in PowerPoint set of vector shapes fully editable by using built-in PowerPoint tools, including
- change the color of all shapes filling and their outline, including icons
- adding shadows
- changing shape and size, rotating, flipping the object
- putting shapes behind or on top of text
Further resources
To deepen your understanding and skills, we suggest exploring additional materials such as our blog and YouTube video, which are trusted sources dedicated to refining presentation decks:
- Blog with examples: 10 Slide Ideas for Effective Go-To-Market Strategy Plan Presentation
- YouTube video: Go To Market Strategy in PowerPoint
Slides included in this PowerPoint Presentation:
- Content of Go-To-Market Strategy Deck
- Go-to-Market Strategy Framework
- Executive Summary
- Market Entry Strategy Examples PPT
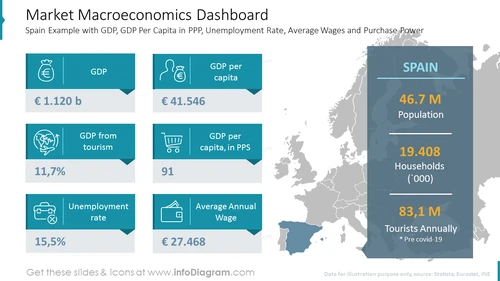
- Market Macroeconomic Dashboard PowerPoint Slide
- Country Demographics Dashboard
- Market Size Comparison Diagram
- Competitive Landscape Analysis Slide | Professional Competitor Analysis PowerPoint Templates
- Location Opportunities in Retail - Retail Location Planning PPT
- Market SWOT Analysis Template
- Entry and Exit Barriers Examples - GTM Strategy Slide
- Targeted Product Portfolio
- Targeted Customer Profile Analysis
- Desired Business Model of Successful GTM Strategy
- Equity Entry Modes - Foreign Market Entry Strategy Presentation
- Potential Business Models
- Financial Highlights of Business Case
- Financial Highlights
- Financial Highlights
- Partnership Maturity Evaluation Matrix
- Potential Partners Comparison
- Preferred Partner Profile Template
- Organization Structure Benchmark
- Timeline of a Rollout to the New Marketplace
- Key Success Factors of New Market Entrance Strategy
- Success Metrics of Effective Marketplace Expansion
- Assessment and Recommendation of the Business Case
- How to use & edit these PPT graphics
- All diagram shapes are easy to adapt
- Editing Outline Icons in PowerPoint
- Go To Market Outline Icons Set – Distribution
- Go To Market Outline Icons Set – Finance
- Go To Market Outline Icons Set – People
- Go To Market Outline Icons Set – Retail
- Go To Market Outline Icons Set – Strategy
- Go To Market Outline Icons Set – Status
- Go To Market Outline Icons Set – Charts
- Go To Market Outline Icons Set – Business
How To Edit
How to edit text & colors

How to expand / shorten diagram

How to Replace Icons in infoDiagram PPT
