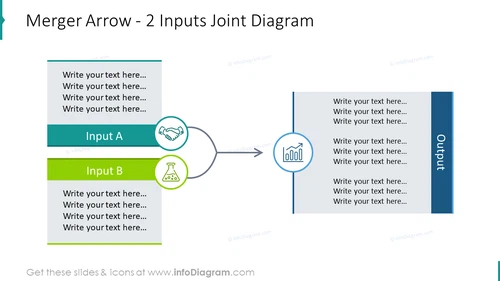
2 inputs joint slide designed with merger arrow
from deck
Branching Thin Arrows for Process Flow Split or Merge (PPT Diagrams)
- Info
- How To Edit
- Usage example
Info
Merger Arrow - 2 Inputs Joint Diagram
Slide Content
This PowerPoint slide is titled "Merger Arrow - 2 Inputs Joint Diagram" and illustrates a process where two distinct inputs, labeled "Input A" and "Input B," converge into a single output through a merging arrow. Each input section contains placeholder text suggesting that specific descriptions or details can be inserted there. The output side also has placeholder text for additional information. "Input A" and "Input B" are meant to represent different components, stages, or aspects coming together seamlessly, possibly implying integration or combination.
Graphical Look
- The slide background is white, ensuring clarity and focus on the content.
- The title is prominently displayed at the top in large, dark blue text, which catches the viewer's attention.
- Two rectangular shapes, one in light blue and the other in green, represent "Input A" and "Input B," respectively, with ample space for custom text.
- Circular icons adjacent to these rectangles depict a handshake for "Input A" and a beaker for "Input B," hinting at potential themes like collaboration and experimentation or research.
- A large arrow emerging from the circles directs the viewer's eyes towards the output, signifying the flow or direction of the process.
- The output section is represented by a vertical dark blue rectangle on the right-hand side, with an icon of a graph or chart, which typically suggests analysis, results, or performance.
- Each section has default text placeholders stating "Write your text here..." inviting the user to provide specific information related to their topic.
The slide has a balanced layout with harmonious colors and simple yet meaningful icons facilitating easy comprehension of the concept of merging inputs.
Use Cases
- Illustrating the integration of two different departments or functions within a company during a presentation on organizational restructuring.
- Demonstrating the combination of skill sets or technologies in a pitch for a new collaborative project.
- Explaining the merging of data sources or strategies ### Slide Content
The PowerPoint slide titled "Merger Arrow - 2 Inputs Joint Diagram" visualizes a process of convergence where two inputs, A and B, merge to produce an output. Input A is linked to collaboration as indicated by a handshake icon, perhaps signifying partnerships or teamwork. Input B, accompanied by a beaker icon, could represent experimentation or research, hinting at data-driven or innovative contributions. This setup is commonly used in contexts such as business integrations, project management, or systems engineering to explain how separate elements contribute to a unified result.
Graphical Look
- Title "Merger Arrow - 2 Inputs Joint Diagram" is set in a dark blue font against a white background.
- Two content blocks for Input A and B are presented in shades of light blue and green, with corresponding icons (handshake and beaker).
- An arrow with a gradient from light blue to dark blue connects the inputs to the output, emphasizing the flow or transition.
- The output block, positioned on the right, is colored in dark blue and matches the title color for consistency.
- A bar graph icon inside a circle precedes the output block, suggesting measurement or result-oriented content.
- Standard placeholder text "Write your text here..." is used in all content blocks to indicate where to add custom information.
The slide leverages a clean and professional design with a logical flow that's visually represented by directional elements such as the arrow. The contrasting colors and simple icons help differentiate between inputs and outputs and provide visual cues to the viewer.
Use Cases
- To display the synthesis of ideas in a brainstorming session or strategic meeting.
- In merger and acquisition presentations to depict the consolidation of assets or functions.
- For illustrating process flow in quality management systems where inputs are analyzed to improve the output.
- To convey the integration of cross-functional team efforts in project development or execution strategies.
How To Edit
How to edit text & colors

How to expand / shorten diagram

How to Replace Icons in infoDiagram PPT


