Financial Decks
Visualize your results with ease
3x3 Dashboard Slide Layout, Yearly Sales Trends Comparison
from deck
Dashboard Layouts for Executive Data Report Presentation (PPT Template)
Info
3x3 Dashboard Slide Layout, Yearly Sales Trends Comparison
Slide Content
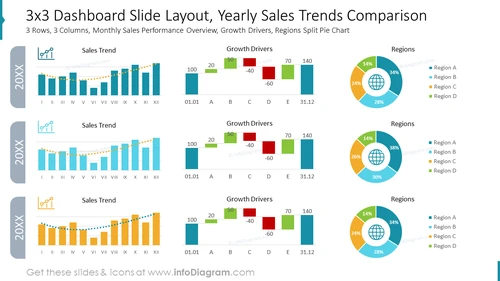
The slide is a visualization of annual sales performance, with nine sections arranged in 3 rows and 3 columns. Each row correlates to a year, as indicated by "20XX" on the left. The first column shows "Sales Trend" with a bar chart tracking monthly sales and a dotted line illustrating the trend over a year. The "Growth Drivers" column displays a waterfall chart detailing positive and negative impacts on sales volumes for specific categories labeled A to E. The final column presents a "Regions" pie chart, dividing sales percentages among four regions: A, B, C, and D. Each concept provides a layer of analysis - the trend depicting general performance, drivers indicating influencing factors, and regions highlighting geographic sales distribution.
Graphical Look
- A large title in blue text spans across the top of the slide.
- Each row contains a consistent layout with unique colors; the top is teal, the middle is blue, and the bottom is orange.
- In the first column of each row, there's a bar chart with monthly sales data for each "20XX" year, differentiated by color.
- Dotted lines overlay the bar charts to show trends.
- The second column on each row features a waterfall chart representing "Growth Drivers," with various shades of blue and green for gains and red for losses.
- The third column in each row has a pie chart with four segments, each corresponding to a sales region.
- Iconography includes a simple graph icon next to "Sales Trend" and a globe icon within each pie chart.
The slide uses a combination of vibrant colors and clear visual elements to represent complex data efficiently. The design is clean, with ample white space ensuring the graphics and data are easily digestible.
Use Cases
- To present annual sales performance comparisons in executive meetings.
- For analyzing sales trends, growth drivers, and regional performance during annual reviews.
- To provide a visual summary of business performance for stakeholders in investor relations communications.
- In sales strategy sessions, to identify which areas require attention or investment based on past performance data.


