Financial Decks
Visualize your results with ease
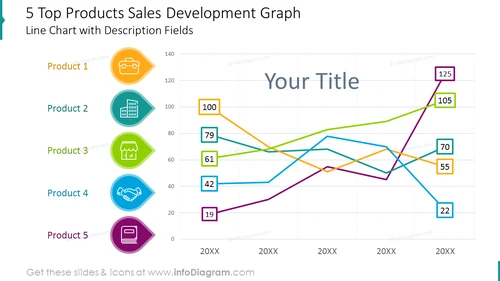
4 Top Products Sales Development Graph
Line Chart with Description Fields
from deck
Product Sales Report Charts (PPT Template)
Info
4 Top Products Sales Development Graph Line Chart with Description Fields Template
This is a PowerPoint multiple line chart expressing the financial sales results of 5 top products. Discuss the sales development, comparing products against each other, and add meaningful descriptions in the legend. Use or replace given icons to introduce products to your audience.
What Does This 4 Top Products Sales Development Graph Line Chart with Description Fields Template Include?
- editable Excel-driven line chart with 5 elements
- colorful product titles on the side
- drop-shaped colorful graphics with icons illustrating products
- outline icons of a suitcase, work, employee, building, office, shop, shaking hands, agreement, book, knowledge
This 4 Top Products Sales Development Graph Line Chart with Description Fields Template is a part of our Product Sales Report Charts PPT Template.


