Financial Decks
Visualize your results with ease
adaptable charts editing example
from deck
Flat Infographic Templates Design Bundle (PPT diagrams and icons)
Info
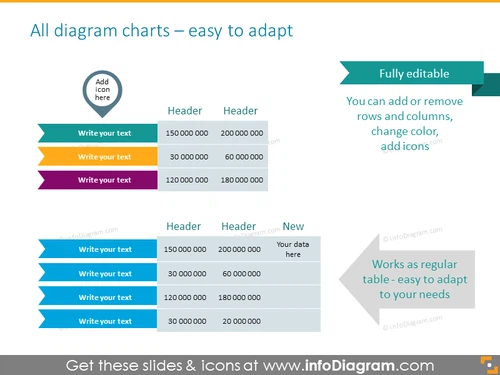
All diagram charts – easy to adapt
Slide Content
The PowerPoint slide titled "All diagram charts – easy to adapt" demonstrates the customizable nature of the chart templates provided. The slide features two sets of chart examples. Each chart includes placeholders for text, suggesting that users can write their own text and input data—explaining that rows and columns can be added or removed, colors can be changed, and icons can be added for further customization. This flexibility can be useful to adapt these charts to different datasets or presentation purposes.
Graphical Look
- The slide has a clean, professional design with a dominant blue and teal color scheme.
- A circular 'Add icon here' placeholder is at the top left with a turquoise ribbon behind it.
- Two tables are presented, visualized with colorful arrow-shaped bars of different lengths and a corresponding set of data points.
- The upper table has arrow bars in green, purple, and yellow, while the lower table features various shades of blue.
- Text placeholders are present on each arrow bar for user input.
- A prominent teal-colored banner extends from the right side of the slide with the text "Fully editable" inscribed.
- Additional notes next to the tables summarize their adaptability, written in white against blue speech bubbles.
- The overall design includes flat graphics, giving the slide a modern and streamlined look.
The slide has a very structured, refined appearance with a clear emphasis on adaptability. The strategic use of colors and flat design icons enhance the readability and appeal of the information being presented.
Use Cases
- To demonstrate how to customize data visualization in business reports or proposals.
- To teach others about creating adaptable charts and tables in presentation design seminars or workshops.
- As a template slide in a sales or marketing presentation to showcase data comparisons or trends effectively.
- To provide a visual aid in a financial meeting, illustrating budget allocations, financial forecasts, or performance metrics.


