Financial Decks
Visualize your results with ease
Annual Products Sales Report
Line Chart with Description Fields
from deck
Product Sales Report Charts (PPT Template)
Info
Annual Products Sales Report Line Chart with Description Fields Diagram
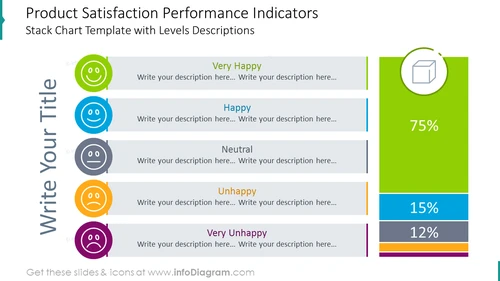
Imaginative PowerPoint diagram for displaying product satisfaction performance indicators. Illustrate the rating with meaningful satisfaction icons and add your descriptions. Utilize the stacked bar graph to show the percentage share between collected ratings.
What Does This Annual Products Sales Report Line Chart with Description Fields Diagram Include?
- 5 editable light grey text containers with titles and colorful circles containing icons for your descriptions
- editable Excel-driven stacked bar chart with an icon illustrating percentage share between ratings
- outline icons of a product, smiled face, slightly smiled face, neutral face, unhappy face, and sad face
This Annual Products Sales Report Line Chart with Description Fields Diagram is a part of our Product Sales Report Charts PPT Template.


