Financial Decks
Visualize your results with ease
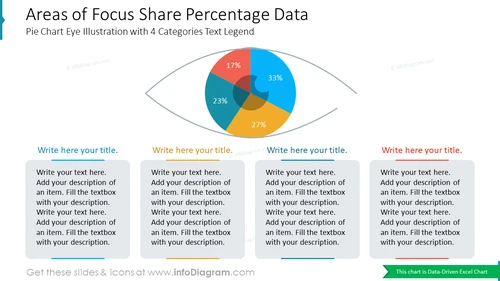
Areas of Focus Share Percentage DataPie Chart Eye Illustration with 4 Categories Text Legend
from deck
Creative Percentage Shares Pie Charts (PPT Template, data-driven)
Info
Areas of Focus Share Percentage Data Pie Chart Eye Illustration with 4 Categories Text Legend
This PowerPoint slide template provides a visually engaging and informative way to present data on the percentage distribution of focus areas. The eye illustration pie chart effectively conveys the relative importance of different focus areas, making it a valuable tool for presentations on strategic planning, resource allocation, or project prioritization. The template's editable features allow for customization to suit specific data and presentation needs.
What Does This Areas of Focus Share Percentage Data Pie Chart Eye Illustration with 4 Categories Text Legend Include?
- A central eye illustration with four distinct Excel-driven pie chart segments embedded within the iris, each representing a focus area
- Color-coded pie chart segments with contrasting shades to enhance visual distinction and facilitate data interpretation
- Clear labeling of each pie chart segment with corresponding focus area names and percentages
- Placeholder text boxes for adding descriptive titles and detailed explanations of each pie chart segment


