Financial Decks
Visualize your results with ease
Beaker chemical glassware data chart
from deck
Chemical Lab Test Tube Graphics (PPT Template)
Info
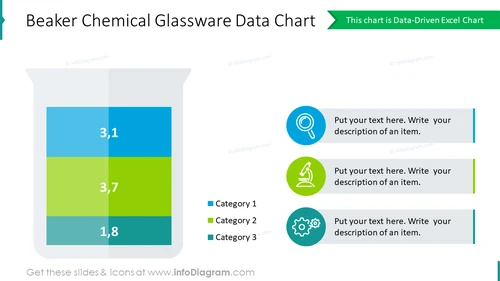
Beaker Chemical Glassware Data Chart Diagram
This bold diagram presents an Excel data-driven stacked data chart as a beaker of chemical glassware filled with different levels of colorful substances. Use this slide to add a creative touch to your presentation or discuss scientific results. Edit all elements of this slide easily and match the look with the rest of your presentation within minutes.
What Does This Beaker Chemical Glassware Data Chart Diagram Include?
- Excel data-driven stacked chart represented as a beaker of chemical glassware filled with different levels of colorful substance with a legend on the side
- 3 editable gray text containers illustrated with icons in colorful circles for your descriptions
- Outline icons of a magnifying glass research, analysis, due diligence, microscope, study, science, gears, process, development
This Beaker Chemical Glassware Data Chart Diagram is a part of our Chemical Lab Test Tube Graphics PPT Template.


