Financial Decks
Visualize your results with ease
Belgium map with places pins
from deck
Benelux Europe Maps with Administrative Territories (PPT editable)
Info
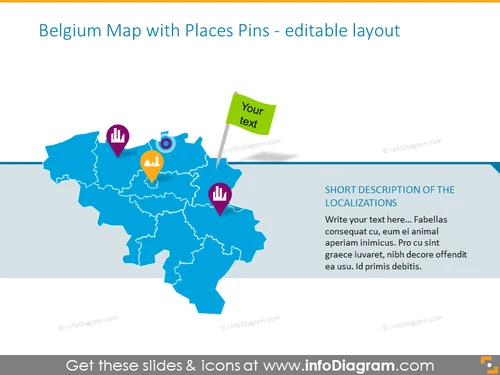
Belgium Map with Places Pins - editable layout
Slide Content
The slide presents a map of Belgium, pinpointed with various colorful location pins, suggesting different places or points of interest. Each pin has a unique icon, such as a target, light bulb, or chart, indicating different types of locations or data points. The slide appears to be designed for customizing the text associated with each pin, implying its editable nature for the presenter to input specific information.
Graphical Look
- A stylized map of Belgium serves as the centerpiece of the slide.
- Five colorful pins are placed on the map, each with a different icon: a target, a light bulb, gears, a graph, and a puzzle piece.
- To the right of the map is a placeholder text box with a sample short description of localizations.
- The placeholder text exemplifies where editable descriptions or contextual information can be input.
- Above the map, a rectangular call-out box contains the placeholder text, "Your text," highlighting the ability to annotate the map further.
- The slide's background is plain white, ensuring that the focus is on the graphical elements.
The overall look of the slide is clear and visually engaging, with colorful pins that stand out against the blue tones of the map. The use of icons within the pins allows for a quick interpretation of the types of places or data points they might represent.
Use Cases
- To illustrate locations of company branches or partners within Belgium for a business presentation.
- To pinpoint market research data points, like survey results or customer distribution across Belgium.
- For educational purposes, such as teaching geography or highlighting significant historical sites in the region.
- In a strategic planning meeting, marking areas of interest for development, competition, or resource allocation.


