Financial Decks
Visualize your results with ease
Demographics signs intended to illustrate Benelux countries profile
from deck
Benelux Europe Maps with Administrative Territories (PPT editable)
Info
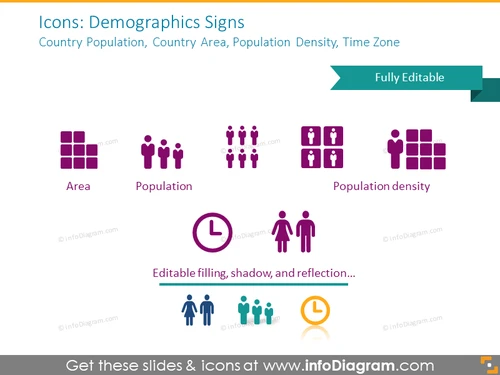
Icons: Demographics Signs
Slide Content
The slide titled "Icons: Demographics Signs" introduces a set of graphical icons related to demographics and statistical representations. These icons signify concepts like country population, country area, population density, and time zone. The 'Area' icon depicts a grid structure, representing geographical plotting or zoning; the 'Population' icon illustrates a group of people, symbolizing a collective of individuals; 'Population density' combines the people icon with grid elements, denoting the concentration of individuals in a given area; and 'Time Zone' is not shown but typically would involve clock imagery to represent different time divisions across the globe.
Graphical Look
- The slide background is a light grey color.
- At the top, there is a teal-colored banner with the slide title in white text. To the right of the title is a teal-colored arrow pointing to the text "Fully Editable."
- Below the title, there are icon graphics in two rows. Each icon has an associated text label.
- The first row has two icons: 'Area' represented by a grid of squares, and 'Population' represented by three pairs of human figures.
- The second row contains a 'Population density' icon, which combines the grid and human figures, and next to it there appears to be a placeholder or space where a 'Time Zone' icon might be placed.
- Each icon is accompanied by a label below it in a dark purple font.
- At the bottom of the slide, there is a dark purple text box with the phrase "Editable filling, shadow, and reflection..." indicating that the icons have customizable properties.
The slide presents a clean design with good use of space and color contrast. The icons are distinct and easily identifiable, aiding in quick communication of demographic concepts.
Use Cases
- Incorporating into a presentation detailing a nation's demographic statistics to provide a quick visual reference.
- Utilizing in educational materials or lectures focusing on geography, urban planning, or sociology to visually represent demographic topics.
- Adding to business reports or market analysis documents to convey information about customer or population segments.
- Enhancing infographics that compare demographic data across different regions or countries.


