Financial Decks
Visualize your results with ease
Icons: Network, Organization, Descent, Speedometer, Dashboard Indicator
from deck
Business Case Presentation (PPT Template)
Info
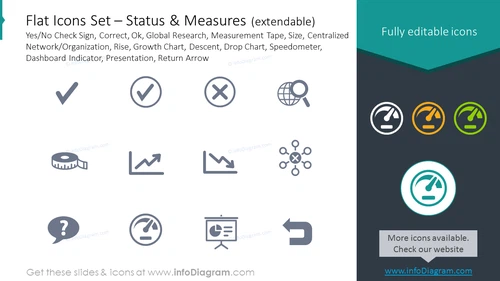
Flat Icons Set — Status & Measures (extendable)
Slide Content
The slide introduces a set of flat icons related to status indicators and measuring concepts, which are extendable and includes editable icons. The icons depicted include symbols representing a broad range of ideas: Yes/No Check Sign (decision icons), Correct/Ok (approval), Global Research (worldwide investigation), Measurement Tape (sizing or measurement), Size (scale), Centralized Network/Organization (interconnected structures), Rise (improvement), Growth Chart (economic or personal development), Descent (decline), Drop Chart (reduction or loss), Speedometer (performance or speed gauge), Dashboard Indicator (monitoring or status display), Presentation (public speaking or reporting), and Return Arrow (direction or return). Each concept is visually encapsulated in a simple, intuitive graphic.
Graphical Look
- The slide has a clean, modern design with a dark background that provides contrast for the white and colored icons.
- A large title in pale turquoise is at the top, set against a white background.
- A total of 12 icons are evenly distributed across the slide in two rows, each labeled with a descriptive text underneath.
- The icons are monochromatic, with the exception of three on the top right that are highlighted in different colors (orange, green, and turquoise) against a darker section of the slide.
- The turquoise-highlighted icon is encircled to draw attention to it, possibly indicating a feature or selection.
- The text and icons are aligned to provide a grid-like structure, contributing to the overall clean and organized presentation.
The overall look is professional and visually appealing, with a clear emphasis on the icons as the main elements of the slide. The color highlights and grid arrangement reinforce the easy navigability and comprehension of the information presented.
Use Cases
- Presenting status updates or progress metrics in business reports and dashboards.
- Demonstrating workflow or process steps in project management and planning presentations .
- Visual aids for quality control or performance management meetings to clarify decision points or outcomes.
- Enhancing instructional or training materials with visual representations of key concepts and measurements.


