Financial Decks
Visualize your results with ease
Circle fragments diagram drawing list of 3 steps
from deck
Shutter Graphic & Circle Segment Diagrams (PPT Template)
Info
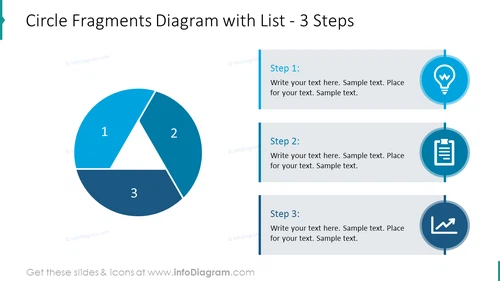
Circle Fragments Diagram with List - 3 Steps
Slide Content
The slide presents a "Circle Fragments Diagram with List - 3 Steps" to display a process or set of related components in a circular format, often symbolizing a whole or cyclical process. It includes placeholders for text to elaborate on each step. Step 1 could represent an initial phase or an idea, Step 2 might be an intermediate task or documentation, and Step 3 could be the outcome or analysis.
Graphical Look
- A large circular diagram divided into three segments labeled with numbers 1, 2, and 3, with different shades of blue.
- To the right of the circle, there are three horizontal structures, each correlating with the pie segments by number.
- Each horizontal structure contains an icon encircled in blue - a light bulb for Step 1, a clipboard for Step 2, and a graph for Step 3.
- The text boxes next to each icon provide a placeholder for descriptive text for each step.
- The icons and text are aligned vertically and connected by a blue line that ties them to their corresponding segment in the circular diagram.
The slide has a clean and professional aesthetic, utilizing a blue color scheme that provides a sense of coherence and visual ease for the viewer. The use of icons and segmentations helps communicate a structured, step-based process.
Use Cases
- Illustrating the phases of a business project or plan in presentations to stakeholders.
- Breaking down the components of a marketing strategy in a corporate meeting.
- Explaining the stages of product development during a team briefing.
- Displaying the steps of a workflow process in a training or instructional session.


