Financial Decks
Visualize your results with ease
Example with using editable column bar charts
from deck
Flat Data-Driven Presentation Charts (PPT template)
Info
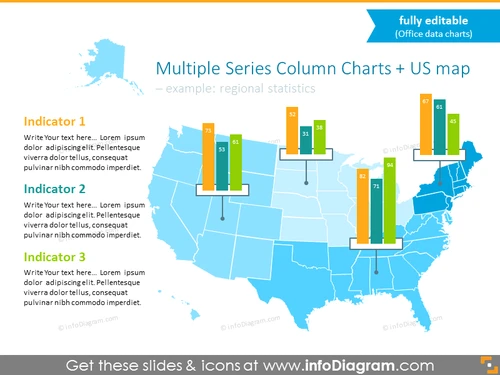
Multiple Series Column Charts + US map
Slide Content
The slide titled "Multiple Series Column Charts + US map" demonstrates regional statistics through a visual representation of data. It's an example of how to display comparative information for distinct regions across the United States. Three "Indicators" suggest categories for comparison, with placeholder text for additional details. Each indicator could describe a specific metric, such as economic data, population statistics, or health indices, providing a quick visual assessment of regional performance or status across these metrics.
Graphical Look
- Blue tone map of the United States in the background, with state borders outlined.
- Color-coded column charts superimposed over certain states on the map, indicating data points for different indicators.
- Each column chart includes three vertical bars in different colors (orange, green, and blue), each corresponding to one of the three indicators.
- Numerical data labels are placed at the top of each column to quantify the indicators' values.
- Three text boxes aligned vertically on the left side of the slide, titled "Indicator 1", "Indicator 2", and "Indicator 3", each with a placeholder text.
- A top-right corner banner stating "fully editable (Office data charts)".
The slide has a clean, professional design with a clear visual distinction between data points. The use of color and placement of the column charts on the map allows for an intuitive comparison of the different statistics across states.
Use Cases
- Presenting regional sales data for a company with distribution across various states.
- Comparing state-by-state performance metrics, such as education levels or healthcare access.
- Visualizing election polling or results by region in a political presentation.
- Illustrating demographic trends or economic indicators in a business or academic report.


