Financial Decks
Visualize your results with ease
Comparison doughnut chart for 5 products
from deck
Pie and Donuts Chart Data-driven Graphics (PPT Template)
Info
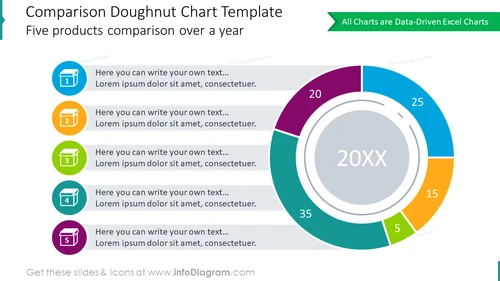
Comparison Doughnut Chart Template
Slide Content
The slide presents a comparative analysis tool titled "Comparison Doughnut Chart Template," focusing on the comparison of five products over a year. The chart shows percentage distributions for each product, indicating their proportion of a whole. Accompanying the chart are five numbered colored sections which likely represent data points or categories for each product. Each section includes a placeholder text suggesting where additional information could be filled in.
Graphical Look
- The slide's background is white, providing a clean and clear canvas for content.
- The title of the slide is at the top in dark text against a light background, enhancing readability.
- A vibrant, multicolored doughnut chart to the right captures attention, with differently sized segments in shades of purple, teal, blue, orange, and green.
- Numbers and percentage values are clearly displayed on the chart segments, emphasizing the quantitative nature of the comparison.
- To the left, there are five colorful icons in blue, orange, green, teal, and purple, each paired with a number from one to five, denoting categories or steps.
- Below each icon is a text box for customization, where presenters can add their informative texts related to each icon.
- At the top right, there's a green banner with white text stating "All Charts are Data-Driven Excel Charts," suggesting the chart's editable nature.
The slide is professionally designed, with a modern and functional aesthetic that balances visual interest and information clarity. The color choices are appealing and help to differentiate the data points.
Use Cases
- Presenting sales data for multiple products over a specific time frame to identify market trends or performance.
- Comparing the market share of different company products or services.
- Illustrating a breakdown of financials such as revenue or expenses by category for a business report.
- Analyzing customer or user segmentations in marketing presentations to highlight target demographics or behaviors.


