Financial Decks
Visualize your results with ease
Four elements comparison matrix template
from deck
Outline Diagrams - Ultimate Deck for Visual Presentations (PPT graphics)
Info
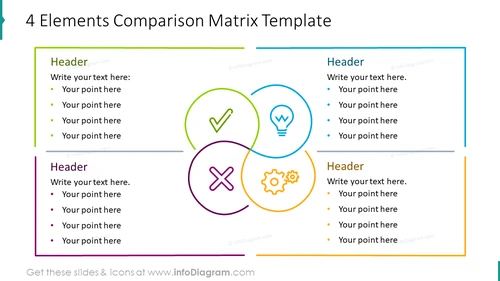
4 Elements Comparison Matrix Template
Slide Content
The slide presents a template for comparing four elements. Each quadrant represents a category or a criterion for comparison, signified by an icon: a checkmark, a lightbulb, a cogwheel, and an 'X' symbol. These icons might illustrate concepts like success, ideas/innovation, processes/systems, and challenges/negatives respectively. Accompanying each graphic is a text box with a "Header" placeholder, suggesting the title of the category, and four bullet points to list specifics or insights related to each category.
Graphical Look
- Four intersecting circles, each with a distinctive color outline: green, blue, orange, and purple.
- Each circle contains an icon that represents a concept: a checkmark, a lightbulb, a gear, and a cross.
- Above each circle is a text box with the word "Header" as a placeholder for the category title.
- A list of bullet points below each "Header" provides space to elaborate on each topic.
- The slide background is white, which contrasts with the vibrant colors of the graphical elements.
- Horizontal lines are placed below the text boxes, providing a visual separation and organizational structure to the slide.
The slide has a clean and professional design with a good use of white space to prevent overcrowding. The use of color helps to differentiate between the four concepts and makes the graphical elements stand out.
Use Cases
- In a business strategy presentation to compare different aspects of a project, such as strengths, weaknesses, opportunities, and threats (SWOT analysis).
- During a product development meeting to contrast features, benefits, challenges, and innovations of a new product.
- In a marketing presentation to compare competitive advantages or unique selling propositions across different market segments.
- As a visual tool in a training session to highlight varied approaches or methods, illustrating the most successful strategies versus least effective ones.


