Financial Decks
Visualize your results with ease
Colorful bridge platform connecting edges graphics with text placeholder
from deck
Bridge & Gap Graphics Template (PPT Diagrams)
Info
Bridge Platform Connecting Edges - Infographics Template
Slide Content
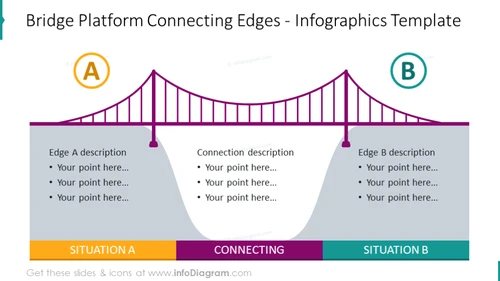
This PowerPoint slide presents an analogy of a bridge to explain connections between two concepts, labeled as "Situation A" and "Situation B." On both sides of the bridge, labeled "Edge A" and "Edge B," there are bullet point lists inviting the presenter to add specific details. "Connection description" in the middle emphasizes the relational aspects or interactions. These lists are meant to detail the attributes or conditions of each situation, and how they interlink to form a coherent narrative or relationship.
Graphical Look
- The slide features a central graphic of a suspension bridge in a slightly curved form, which spans the width of the slide.
- The bridge is depicted in a purple color, contrasting with the lighter purple and gray-ish background.
- On the top left and right corners, there are two circular icons with letters 'A' and 'B', colored orange and blue respectively.
- Below the bridge graphic, there are three distinct text boxes with headings "Situation A," "Connecting," and "Situation B" in bold letters.
- Each text box contains bullet points with the placeholder text "Your point here..."
The overall look of the slide is modern and metaphorical, with a clean design that uses color coding to highlight different areas and points of focus.
Use Cases
- To compare and contrast two different products, services, or strategies within a business presentation.
- To outline the before and after states of a business transformation or the impact of implementing a new process.
- To illustrate synergies or the integration process during a merger or acquisition discussion.
- As a visual aid for explaining the relationship between two concepts or entities in educational or training sessions.


