Financial Decks
Visualize your results with ease
Global logistics flow slide describing export and import worldwide
from deck
Construction Crane Presentation Graphics (PPT Template)
Info
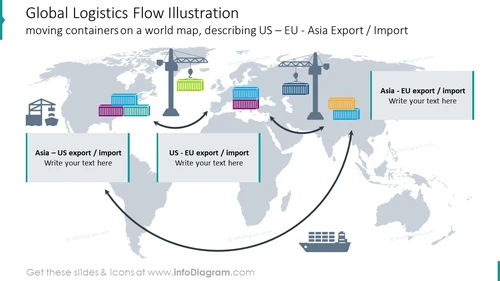
Global Logistics Flow Illustration
Slide Content
This slide, titled "Global Logistics Flow Illustration," depicts the movement of containers on a world map to describe the export and import processes among the US, EU, and Asia. Each trade route is represented by an arrow and is accompanied by a corresponding colored container symbol. The routes are Asia-US, US-EU, and Asia-EU. Text boxes below each route offer space for additional explanation about the nature of the trade exchange.
Graphical Look
- A faded world map serves as the background for the slide, spanning the entire content area.
- Colored container icons (purple, blue, green, orange, and yellow) are placed near the edges of various continents to symbolize goods.
- Cranes depicted above the containers suggest the act of loading or unloading these goods.
- Curved arrows between the continents illustrate the flow of trade between regions: one each for Asia-US, US-EU, and Asia-EU routes.
- Three highlighted text boxes aligned with each trade route arrow provide a space for customized details or descriptions.
The slide features a clean, professional design with a gray color scheme accented by colored containers and highlighting. The graphics effectively convey a sense of global trade dynamics through visualization of logistics movements.
Use Cases
- Illustrating trade relationships and logistics operations in an international business presentation.
- Explaining global supply chain networks in an educational or training setting for logistics and management.
- Showcasing a company's import/export capabilities during investor meetings.
- Comparing trade volumes and routes in an economic or market analysis report presentation.


