Financial Decks
Visualize your results with ease
Current processes diagram shown with list description and creative flat chart
from deck
Business Case Presentation (PPT Template)
Info
Current Processes
Slide Content:
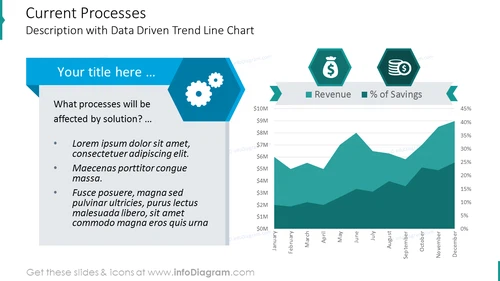
The PowerPoint slide is designed to offer a detailed analysis of current processes with a focus on trends over time, as indicated by a trend line chart. The title suggests a discussion on processes affected by a new solution, and the bullet points provide a structure for presenting problems, proposed solutions, and expected benefits. The trend line chart, with dual indicators for revenue and percentage of savings, provides a visual representation of financial performance over a yearly quarter.
Graphical Look:
- A large, bold title at the top.
- A light blue text box with a title placeholder that can be customized.
- A list with three bullet points for text content on the left side of the slide.
- Two hexagonal icons, one with a dollar sign symbolizing revenue and the other with a stack of coins symbolizing savings.
- A layered trend line chart displaying two sets of data, with months on the horizontal axis and financial figures on the vertical axis.
The overall design employs a professional color palette of blues and greens, creating a corporate feel. The hexagonal shapes add a modern geometric touch, while the chart provides a clear visual of data trends.
Use Cases:
- In financial review meetings to discuss performance metrics and cost savings.
- For strategic planning sessions to visually present the impact of operational changes.
- During shareholder or board meetings to report on company financial health.
- As part of a business analyst's presentation to highlight trends and forecast future performance.


