Financial Decks
Visualize your results with ease
Numbers Table Example
from deck
Flat Infographic Templates Design Bundle (PPT diagrams and icons)
Info
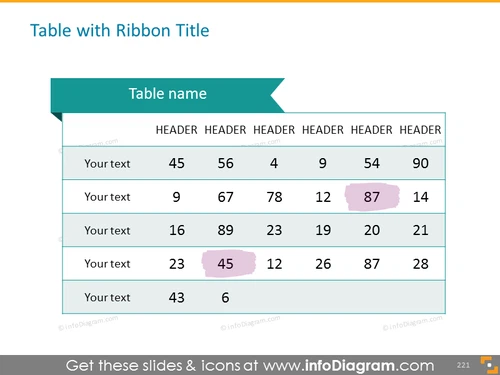
Table with Ribbon Title
Slide Content
The slide displays a table titled 'Table name' under a stylish ribbon, featuring a series of headers and corresponding data rows. Each row begins with a placeholder for text followed by numerical data, such as '45', '56', etc. Several cells are highlighted in different colors, which might be used to emphasize particular data points or categories, indicating their significance within the table. This format is typical for presenting data comparisons, status reports, or specific metrics in a straightforward, organized, and easily digestible manner.
Graphical Look
- A large teal ribbon graphic at the top contains the words "Table name" in white text.
- Below the ribbon is a table with a light background and a white border.
- The table headers are in dark text and appear across the first row of the table.
- Six rows contain data with placeholders saying "Your text" in the first column and numerical data in the succeeding columns.
- Some cells have numerical data highlighted with colors: soft purple and dark teal.
The slide has a clean and modern design, with the ribbon adding visual interest and a point of focus. The use of color highlighting within the table effectively draws attention to key data points.
Use Cases
- Presenting financial results or budget forecasts in a corporate environment.
- Comparing sales figures or performance data across different departments or time periods.
- Displaying research statistics or survey results in a presentation for stakeholders.
- Summarizing key performance indicators (KPIs) in a scorecard format during business reviews.


