Financial Decks
Visualize your results with ease
Reporting, data, usage statistics
from deck
Connected Home Internet of Things (PPT icons)
Info
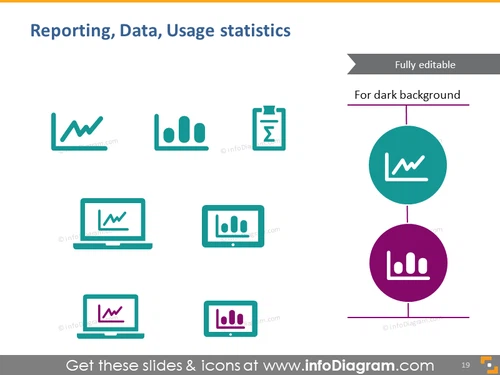
Reporting, Data, Usage statistics
Slide Content
The PowerPoint slide is titled "Reporting, Data, Usage statistics" and presents a collection of icons and infographics representing different aspects of data management and analysis. The slide seems to highlight essential tools and processes used for reporting and visualizing usage statistics, such as graph/chart icons, a clipboard with a check mark, and laptop screens with data representations. Each icon represents a different aspect of data interaction: line chart for trend analysis, bar graph for comparisons, clipboard for data verification, and laptops for data processing and presentation.
Graphical Look
- A line chart icon symbolizing trend analysis or time series data.
- A bar graph icon representing comparative data or categories.
- A clipboard with a check mark icon depicting data verification or completed tasks.
- Two laptops, each displaying either a line chart or a bar graph, signifying data analysis or report preparation.
- The icons are in a muted teal color, which suggests a professional and clean design aesthetic.
- There is a vertical line connecting two circular shapes, one teal and one purple, each containing a data-related icon. It suggests a connection or flow between two data processes or ideas.
- The background of the slide is white, which enhances the visibility of the icons.
- The text "Fully editable" and "For dark background" in the top right corner, refers to the slide's adaptability for user customization.
The slide has a clean, modern look with a straightforward layout that emphasizes the icons. The use of colors is subtle, primarily composed of teal and purple, which adds a touch of visual interest without being overwhelming.
Use Cases
- To introduce a section on data analysis in a business presentation.
- As an agenda slide for a meeting focused on discussing reporting strategies and statistics usage.
- To visually enhance a training module that teaches how to interpret and present data.
- For illustrating the types of data visualizations and tools a company uses in its reporting processes.


