Financial Decks
Visualize your results with ease
Demographics Signs: Population, Country Area, Population Density
from deck
Balkan Europe Maps with Administrative Regions (Serbia, BiH, Montenegro… PPT editable)
Info
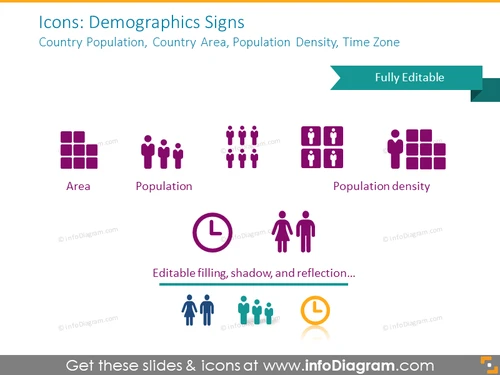
Icons: Demographics Signs
Slide Content
The slide presents a collection of demographic icons with labels that could be useful in various analytical contexts. The four icons—Area, Population, Population Density, and Time Zone—represent different demographic aspects. Area is illustrated by a grid, implying geographic measurement. Population is signified by a group of figures, referring to the count of individuals. Population Density associates a larger group of figures with a grid, symbolizing the number of people within a specific area. Time Zone is denoted by a clock face with a figure, indicating regions sharing the same standard time.
Graphical Look
- The slide background is white, maintaining focus on the content.
- The title "Icons: Demographics Signs" is prominently displayed at the top in dark text.
- Under the title, there is a subtitle in a smaller font that lists the examples of use: "Country Population, Country Area, Population Density, Time Zone."
- A ribbon banner labeled "Fully Editable" is stretched across the top right corner.
- The main content comprises four icons, evenly spaced in a row, each with a descriptive label underneath:
- "Area" is represented by a square icon made up of smaller squares.
- "Population" shows a group of stylized human figures.
- "Population density" combines the human figures with the square grid pattern from the Area icon.
- "Time Zone" displays a clock face next to a single human figure.
- Each icon has a distinct, simple geometric design for easy identification.
- Below the icons is a note mentioning "Editable filling, shadow, and reflection," hinting at the customizability of the icons.
- The slide uses a consistent color scheme of purple and teal to create a visually appealing and harmonious design.
The slide has a clean and modern look with easily interpretable icons and a minimalistic color scheme that avoids overwhelming the viewer. The consistent use of color and simple graphics ensures the audience can quickly grasp the demographic concepts depicted.
Use Cases
- In a presentation analyzing demographic trends, to visually represent key data points such as population growth or urban density.
- In educational materials to explain demographic concepts, using the icons as recognizable symbols to aid in teaching.
- In marketing presentations to segment target audiences by demographic criteria, using the icons for quick visual reference.
- In policy-making or urban planning discussions, where visual aids can help emphasize statistics on population and area-related metrics.


