Financial Decks
Visualize your results with ease
Dense Table Style 10+ Rows, 4 Columns
from deck
Business PowerPoint Table Design & KPI List, Flat Style (PPT Template)
Info
Dense Table Style 10+ Rows, 4 Columns
Slide Content
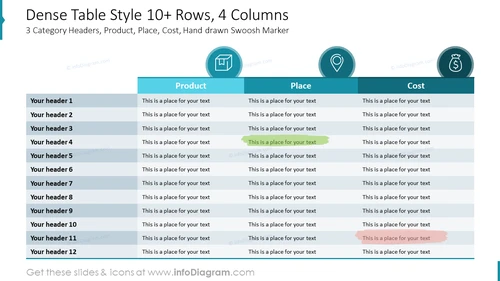
The slide presents a detailed table structure titled "Dense Table Style 10+ Rows, 4 Columns" with additional subtitles "3 Category Headers, Product, Place, Cost, Hand drawn Swoosh Marker." This table is segmented into four columns, with the headers "Product," "Place," and "Cost" indicative of different categories of information. Under each of these headers, there are rows with placeholder text. The "Hand drawn Swoosh Marker" seems to highlight certain rows, suggesting a method for emphasizing particular data within the table.
Graphical Look
- The slide background is a clean, light teal color.
- At the top, the slide title is presented in a large, bold, dark blue font.
- There are three main category headers ("Product", "Place", and "Cost") in light blue rectangles with a darker blue font.
- Each category header is associated with a corresponding icon: a package for "Product," a location pin for "Place," and a money bag for "Cost."
- The table contains multiple rows, each beginning with a grey header on the left stating "Your header" followed by numbers 1 through 12, indicating the row identifiers.
- Table rows are alternatively shaded in white and a pale shade of the background color to distinguish them.
- Several rows are highlighted with a hand-drawn swoosh marker in green, drawing attention to the placeholder text in those specific rows.
The slide utilizes a combination of icons and hand-drawn elements to create a visually engaging table layout. The color palette is cohesive and professional, with use of teal, white, blue, and green creating a balanced visual aesthetic.
Use Cases
- Presenting complex data sets that include multiple categories and require clear segmentation for easy analysis.
- Reporting financial information where cost comparisons across different products and locations are necessary.
- Highlighting key performance indicators or important figures in sales presentations. I'm sorry, but there is no attached picture for me to describe. If you have an image you'd like me to describe, please attach it to your message.


