Financial Decks
Visualize your results with ease
Documents, Reports and Analysis pictograms
from deck
Status Review Meeting Template (PPT graphics)
Info
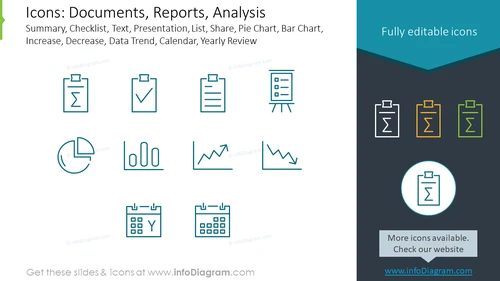
Icons: Documents, Reports, Analysis
Slide Content
The slide presents a collection of icons associated with documents, reports, and analysis, suitable for business and academic presentations. "Summary" is likely indicative of a condensed version of information, "Checklist" implies items to be reviewed or actions to be taken, "Text" could represent written content or document focus, "Presentation" hints at showcasing information, "List" may suggest itemization, "Share" conveys distribution or collaboration, "Pie Chart" and "Bar Chart" indicate data visualizations, "Increase" and "Decrease" show upward or downward trends, "Data Trend" signifies analyzing data over time, and "Calendar" and "Yearly Review" suggest scheduling or annual summarization.
Graphical Look
- The slide title is prominently displayed at the top in bold, dark blue text.
- A subtitle below the title describes the icons in lighter blue.
- Icons are arranged in three rows, with outlines in a teal blue color.
- Each icon graphically represents its function, such as a checkmark for Checklist or graphs for Increase and Decrease.
- The slide background is white in the center with a darker blue header that has a cutout wave design transitioning to the main area.
- The words "Fully editable icons" are situated in the dark blue header area in white text.
- Icons are grouped with three on the top row, five in the middle, and two on the bottom row.
- One icon is encircled and enlarged, emphasizing its significance.
The slide has a clean and modern design with a cool color scheme that effectively highlights the icons. The overall layout is balanced and easy to navigate visually.
Use Cases
- Utilize in business meetings to discuss documentation or report development stages.
- Integrate into training materials to symbolize various analytical tools or practices.
- Employ in project updates to visually represent the types of data analysis being conducted.
- Embed in marketing pitches to illustrate capabilities for data analysis and report generation offered by a software or service.


