Financial Decks
Visualize your results with ease
Net Electricity Generation 2010
from deck
Ecology icons: Energy, Natural Resources and Ecosystem (flat PPT clipart)
Info
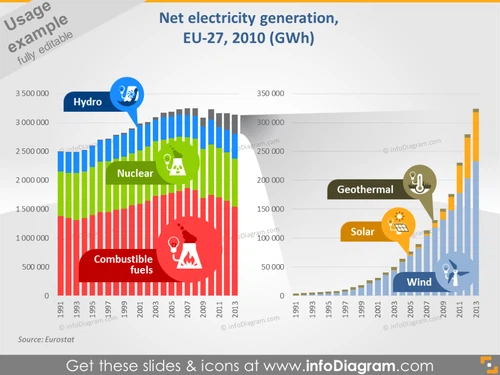
Net electricity generation, EU-27, 2010 (GWh)
Slide Content
The slide presents data on EU-27 net electricity generation in 2010 measured in gigawatt-hours. The bar chart showcases different energy sources such as Hydro, Nuclear, Combustible fuels, Geothermal, Solar, and Wind. Hydro, depicted in blue, has prominent generation figures, while Nuclear in nuclear green and Combustible fuels in red also show significant contributions. Renewable energies like Geothermal, Solar, and Wind are illustrated with smaller yet impactful data points, indicating the diversity in the EU's energy mix.
Graphical Look
- The slide features a colorful bar chart with a horizontal orientation.
- Each bar in the chart represents a year from 1991 to 2013 and is color-coded to differentiate the types of electricity generation.
- Icons depict each type of electricity generation source: a drop of water for Hydro, a nuclear symbol for Nuclear, a flame for Combustible fuels, Earth for Geothermal, a sun for Solar, and a windmill for Wind.
- Callout labels with a contrasting background color highlight the names of the different energy sources directly on the chart.
- Secondary vertical axes on the right provide scale for the smaller-quantity energy sources, ensuring all data is clearly represented.
- A gray area in the background establishes a secondary chart area distinct from the primary data presentation.
- The data source, "Eurostat," is credited in a discreet footer at the bottom left.
The slide is neatly organized with a strong visual hierarchy aiding in the interpretation of complex data. The color-coding and icons are effectively used for immediate recognition of the different energy sources.
Use Cases
- This slide can be used in business presentations to discuss energy market trends and patterns in the EU.
- It's suitable for environmental and sustainability reports to illustrate the shift towards renewable energy sources.
- The slide can be included in policy-making or economic presentations to support discussions on energy dependency and energy security in the European context.
- It can be used in educational contexts for teaching about energy production, comparing different sources, and highlighting their growth over time.


