Financial Decks
Visualize your results with ease
Example of the demographics signs
from deck
CEE Europe Maps with Administrative Territories (PPT editable)
Info
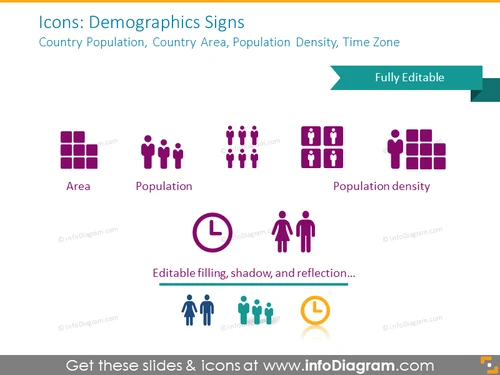
Icons: Demographics Signs
Slide Content
The PowerPoint slide is titled "Icons: Demographics Signs" and deals with visual representations of demographic data. The slide contains icons that represent the "Country Population," "Country Area," "Population Density," and "Time Zone." These icons provide a visual shorthand for conveying complex demographic information succinctly. "Area" is presented with a grid of squares, indicating the measure of the physical land extent. "Population" is shown with a group of figures, suggesting the number of people in a given area. "Population density" combines the figure and grid elements to represent the number of people per area unit.
Graphical Look
- Title "Icons: Demographics Signs" is prominent at the top of the slide in large, bold text.
- A subheading stating "Country Population, Country Area, Population Density, Time Zone" provides context for the icons.
- The phrase "Fully Editable" is displayed in a teal banner that points right, suggesting that the icons' design can be modified.
- Four sets of icons are displayed below the title, each corresponding to a demographic category.
- "Area" is symbolized by a set of square shapes.
- "Population" is depicted using a group of human-like figures.
- "Population density" is illustrated with combined elements of figures and squares, indicating more people in a smaller area.
- A time-related icon appears to be mentioned, but it is not visible in the provided image.
- Text below the icons states "Editable filling, shadow, and reflection..." which points to the customization features of the icons.
- Icons are in a shade of purple, and the customizability feature text is in gray.
- Each icon label is clearly written in simple text below the corresponding graphic.
The slide has a modern and clean design, with plenty of white space around the icons and text for a clutter-free look. The use of a single color theme for the icons maintains a visual consistency throughout the slide.
Use Cases
- During a demographic analysis presentation, to quickly convey key population metrics.
- In marketing strategy meetings, to illustrate target market sizes and densities.
- For educational purposes, such as teaching students about demographic terminology through visual aids.
- Within urban planning or development proposals to outline population-related aspects of a region.


