Financial Decks
Visualize your results with ease
Agriculture crops and food in numbers
from deck
Food and Agriculture icons bundle: Animals, Crop Cultivation, Forestry (PPT flat clipart)
Info
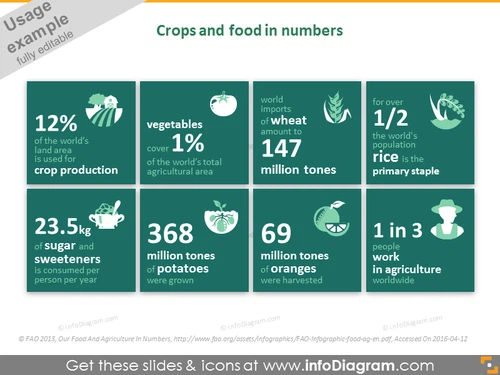
Crops and food in numbers
Slide Content
The slide titled "Crops and food in numbers" presents statistical insights into global agricultural production and consumption. It shows that 12% of the world's land area is used for crop production, which signifies the extent of land dedicated to agriculture. Vegetables account for 1% of the world's total agricultural area, highlighting their smaller share in global agriculture space. The slide also notes the consumption of 23.5 kg of sugar and sweeteners per person per year, illustrating the high level of sweetener consumption. It reports 368 million tonnes of potatoes and 69 million tonnes of oranges were grown and harvested respectively, representing significant quantities. The trade information indicates 147 million tonnes of wheat are imported worldwide, reflecting its global importance. Additionally, rice is the primary staple for over half the world's population and 1 in 3 people work in agriculture worldwide, underlining the importance of agriculture in employment and food security.
Graphical Look
- The slide background is dark grey, and it contains eight dark green rectangular blocks with rounded corners.
- Each block features a light green icon related to agriculture, such as a barn, vegetable, wheat, rice, sugar cubes, potato, orange, and a chef's hat representing workers.
- White and turquoise text provides data related to each icon’s topic.
- A consistent font style and size are used for the main data points, enhancing readability.
- The icons and text are aligned in a neat grid layout, with four blocks per row.
- Each data block is separated by a thin space, creating a visual separation between topics.
The slide has a modern and professional look, using a harmonized color palette of greens and white for clarity and visual appeal. The grid layout and combination of icons with data create an easy-to-understand presentation of facts.
Use Cases
- This slide could be used in a presentation for an agriculture-related business conference to highlight industry statistics.
- It could be incorporated into educational materials or workshops to teach about global agricultural trends and consumption patterns.
- This slide would be fitting for an environmental or economic report to discuss the impact of agriculture on land use and global trade.
- A non-governmental organization (NGO) focusing on food security could use this slide to illustrate key facts and figures to stakeholders or donors.


