Financial Decks
Visualize your results with ease
Five Set Euler Diagram including Three Inclusive Categories Shared & Overlapping Two Main Categories
from deck
Euler Diagrams of Set Relationship (PPT Template)
Info
Five Set Euler Diagram
Slide Content
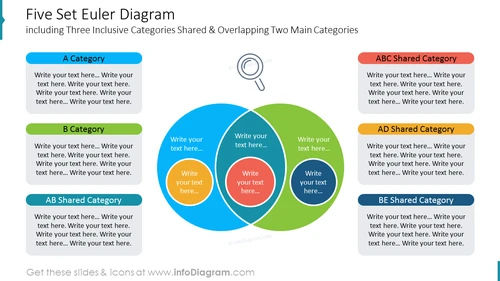
The slide titled "Five Set Euler Diagram" illustrates an advanced Venn diagram with five distinct categories and areas where these categories overlap. The "A Category" and "B Category" are primary classes, each with a designated space for additional text. The "AB Shared Category" signifies the intersection between categories A and B, implying a relationship or commonality they share. There are also sections for "ABC Shared Category" and "AD Shared Category," indicating more complex relationships between three or more categories. Finally, the "BE Shared Category" suggests an overlap between category B and another category E not explicitly defined on the slide.
Graphical Look
- The title of the slide is prominently displayed at the top center in bold, dark blue text.
- A large magnifying glass icon sits above and to the right of the main diagram, suggesting analysis or closer inspection.
- The main feature is a Venn diagram with two primary overlapping circles in blue and green, with smaller intersecting circles in red, yellow, and another shade of blue, representing different shared categories.
- Rectangular text boxes, color-coded to match the diagram segments (blue, green, red, yellow, and another blue), are placed around the main diagram for descriptive text.
- Each text box contains placeholder text instructing where to put actual content.
- The slide uses a white background which makes the colored elements stand out.
The slide employs a clean, professional design with a simple color scheme, making it visually appealing. The use of varying colors helps differentiate between categories and shared segments clearly.
Use Cases
- To illustrate complex relationships and intersections between multiple groups or concepts in a business strategy or marketing presentation.
- For educational purposes, to explain how different subjects or areas of study might overlap and interact with each other.
- In project management presentations, to demonstrate how varied components of a project might intersect or require integration.
- During brainstorming sessions, to identify potential areas of synergy between different teams, departments, or product lines.


