Financial Decks
Visualize your results with ease
Funnel & Waterfall Chart Objects
from deck
Dashboard Layouts for Executive Data Report Presentation (PPT Template)
Info
Funnel & Waterfall Chart Objects
Slide Content
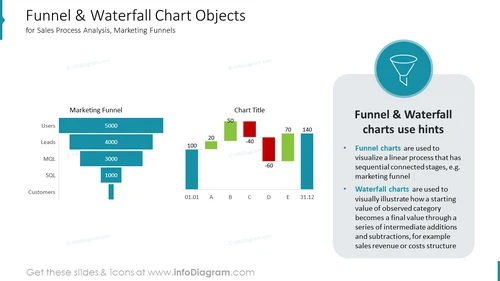
This PowerPoint slide is titled "Funnel & Waterfall Chart Objects" and is intended for Sales Process Analysis, Marketing Funnels. It presents a "Marketing Funnel" on the left, illustrating a decrease in quantity from users to customers, with numbers like 5000 for users and 1000 for SQL. On the right, there is a "Waterfall Chart" with positive and negative values, such as 20 for 'B' and -40 for 'C', and a "Funnel & Waterfall charts use hints" section explaining the application of funnel charts in representing linear processes and waterfall charts in showing how starting values change through additions and subtractions.
Graphical Look
- The slide has a clean, modern design with a light background.
- The title is prominently displayed at the top in a large, bold font.
- Two main graphical elements: a horizontal marketing funnel chart and a vertical waterfall chart.
- The marketing funnel chart contains four horizontal bars of decreasing length, representing stages from "Users" to "Customers".
- Each bar in the funnel chart is labeled with a number indicating quantity.
- The waterfall chart includes blocks of different heights and colors, some extending above (positive values) and some below (negative values) a baseline.
- To the right of the charts, there's an info-box with a light grey background and rounded corners.
- The info-box includes an icon of a funnel at the top half, and two bulleted points below it providing use hints for both chart types.
- The charts and info-box are visually balanced, with a mix of blue, green, and red colors.
The overall look of the slide is professional and straightforward, with a well-organized layout that uses color and positioning effectively to convey information about funnel and waterfall charts.
Use Cases
- To present marketing strategies and conversion rates at a business meeting.
- For financial analysts to explain changes in revenue or costs.
- During management or sales presentations to demonstrate sales process efficiencies.
- To visualize and discuss customer journey and attrition rates in marketing workshops or seminars.


