Financial Decks
Visualize your results with ease
Monthly gantt chart template
from deck
Gantt Chart Graphics for Project Planning (PPT Template)
Info
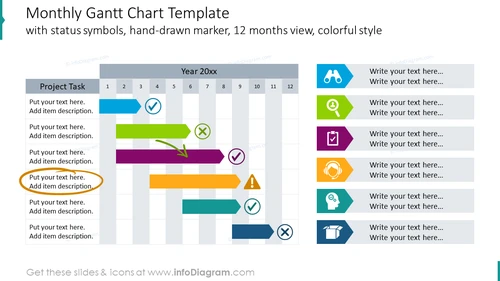
Monthly Gantt Chart Template Slide
This colorful yearly Gannt diagram allows marking events over the following months. Use it to discuss projects in your company, indicating their status and importance with specific colors, icons, and scribbled markers such as arrows or ovals. Add descriptions in the illustrated comment section on the side. Learn more about the Gannt chart on Wikipedia.
What Does This Monthly Gantt Chart Template Slide Include?
- Calendar table presenting 6 projects over the following 12 months
- Editable colorful arrow-shaped markers of projects placed against the calendar table
- 6 gray text containers with colorful arrow-shaped graphics containing icons for your descriptions
- Scribbled markers: an arrow, and an oval
- Outline icons of a check mark and cross mark
- Flat icons of an exclamation mark, importance, issue, binocular, forecast, prediction, magnifying glass, research, clipboard, check, compliance, approval, assistance, support, analysis, design-thinking, box, product
This Monthly Gantt Chart Template Slide is a part of our Gantt Chart Graphics for Project Planning PPT Template.


