Financial Decks
Visualize your results with ease
Gender ratio distribution infographics
from deck
Gauge Charts for KPI Dashboards (PPT Template)
Info
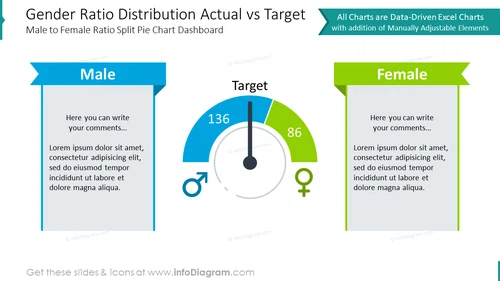
Gender Ratio Distribution Actual vs Target
Slide Content
The PowerPoint slide titled "Gender Ratio Distribution Actual vs Target" presents data on gender ratios using a split pie chart dashboard. The slide is split into three sections: "Male," "Target," and "Female." Each section has space for comments and accompanying lorem ipsum placeholder text. The "Male" and "Female" sections provide a platform for commentary, while the "Target" section features a gauge chart with numerical values indicating actual (136) and target (86) gender ratios, represented by the blue and green sections respectively.
Graphical Look
- The slide has a clean, professional design with a white background.
- The title of the slide is in large, bold, dark gray text.
- There is a subtitled text under the main title in smaller font size.
- Three rectangular boxes, colored blue, dark gray, and green represent the Male, Target, and Female sections, each with a ribbon-like banner at the top displaying the section name.
- Inside the blue and green boxes, there are placeholders for text in a smaller font, with italicized instructions "Here you can write your comments..."
- The gauge chart in the center is a semi-circle with a gradient fill from dark blue to green, with a needle pointing at a value between two marked sections.
- Male and Female symbols are placed next to the gauge chart, denoting the gender-related aspect of the data.
- The numerical values inside the gauge chart are large and bold, making them the focal point.
The slide has a balanced layout with visual elements that convey the concept of measuring actual performance against set targets. Icons and color-coding are used effectively to distinguish between genders.
Use Cases
- Presenting gender diversity metrics in corporate HR presentations.
- Analyzing demographic data in market research reports.
- Setting and reviewing diversity goals in strategic planning sessions.
- Comparing actual statistics with benchmarks in social science studies.


