Financial Decks
Visualize your results with ease
Hexagon Calendar Timeline Diagram for 6 months
from deck
Flat Infographic Templates Design Bundle (PPT diagrams and icons)
Info
Slide Content
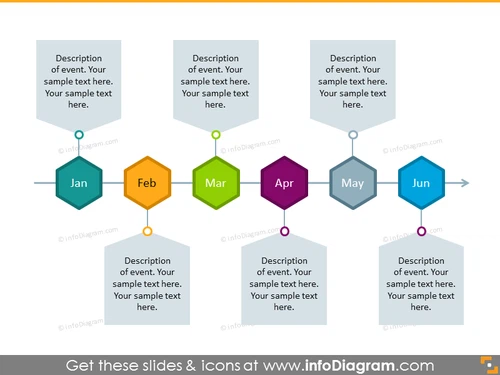
This PowerPoint slide is designed to present a timeline of events across six months, from January to June. Each month is represented by a hexagonal icon with a distinct color, labeled with the three-letter abbreviation of the month (e.g., "Jan" for January). Under each month's icon is space to add descriptions of relevant events. This setup allows the audience to grasp the chronological flow of events at a glance, and the dual-layer text boxes provide room to elaborate on specific details that define each event, improving the slide's instructiveness.
Graphical Look
- The slide has a light gray background.
- At the center, there is a horizontal timeline composed of hexagonal icons connected by a gray line.
- Each hexagon represents a different month and has its own unique color: blue for January, yellow for February, green for March, purple for April, cyan for May, and light blue for June.
- The hexagons are evenly spaced along the timeline and include a colored circular marker on top with a ball effect, correlating with the color of the hexagon.
- Above and below the timeline, there are rectangular text boxes for adding descriptions related to each month. These boxes have directional tails that align with their respective month's color and icon.
- Each text box contains a placeholder text "Description of event. Your sample text here."
- The hexagons have a subtle shadow effect giving the impression of depth.
The slide has a clean and professional look, utilizing colorful hexagons to distinguish between months while maintaining a cohesive structure. The use of color-coding pairs well with the simplicity of the design, making information easy to follow for the audience.
Use Cases
- To present project milestones and deadlines in a business strategy meeting.
- To outline the phases of product development in a marketing presentation.
- For a timeline of company achievements or upcoming events during a quarterly business review.
- To display historical company data or forecasted timelines during investor presentations. I'm sorry, but there appears to be a misunderstanding. You have not provided an image for me to analyze. If you could please provide the image, I would be happy to assist you with your request.


