Financial Decks
Visualize your results with ease
Human Resources Remuneration Dashboard Example
from deck
Dashboard Layouts for Executive Data Report Presentation (PPT Template)
Info
Human Resources Remuneration Dashboard Example
Slide Content
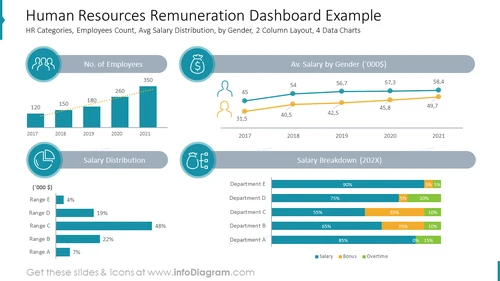
The slide titled "Human Resources Remuneration Dashboard Example" illustrates various HR metrics, divided into four main sections: "No. of Employees" showcasing a rising bar chart of employee count over five years, "Av. Salary by Gender ('000s)" depicting a line graph comparing average salaries by gender over five years, "Salary Distribution" representing the percentage distribution across five salary ranges, and "Salary Breakdown (202X)" presenting a stacked bar chart of salary, bonus, and overtime for five departments.
Graphical Look
- The slide background is white, with a prominent dark turquoise header containing the slide title in white text.
- There are four key data representation areas, each with a circular icon above in shades of blue and green:
- A group icon for "No. of Employees".
- A dollar sign icon for "Average Salary by Gender".
- A clock face icon for "Salary Distribution".
- A briefcase icon for "Salary Breakdown".
- The first chart is a bar chart with teal bars incrementally increasing from left to right, with dotted lines connecting the tops of the bars.
- The second chart is a dual-line graph with one line in blue representing one gender and the second line in orange for another, with data points marked by circles.
- The third section has a series of horizontal bars in teal corresponding to different salary ranges, labeled Range A to Range E, with their respective percentages listed.
- The fourth section is a horizontal stacked bar chart, with each bar comprising three segments: dark teal for salary, orange for bonus, and light gray for overtime, each labeled by department from A to E.
The overall look of the slide is clean and modern, using a consistent color scheme. The icons, charts, and text are arranged in a balanced, easily digestible format.
Use Cases
- Presenting an overview of HR metrics in management or shareholder meetings.
- Using in departmental reviews to discuss staff compensation trends and budget allocations.
- Incorporating into HR strategy presentations to illustrate workforce growth and remuneration policies.
- Including in annual reports for stakeholders to convey the company's human capital development and investment.


