Financial Decks
Visualize your results with ease
KPI diagram shown with four bar charts and key values description
from deck
Company Finance Data Charts (PPT Template)
Info
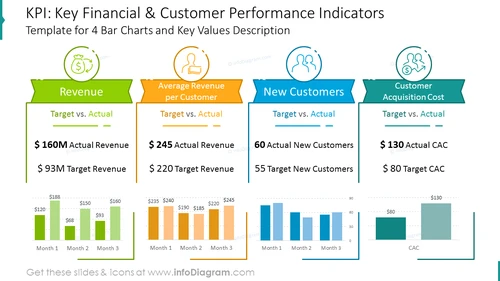
KPI Diagram Shown With Four Bar Charts and Key Values Description Template
This editable PPT template allows a convenient listing of 4 key financial and customer performance indicators: revenue, average revenue per customer, new customer, and customer acquisition cost. All KPIs are illustrated with editable bar charts and well-titled with key numeric values (actual revenue and target revenue), which are easy to compare.
What Does This KPI Diagram Shown With Four Bar Charts and Key Values Description Template Include?
- 4 editable sections for PKIs with icons, titles, descriptions, and bar charts
- outline icons of a bag of money, investment, revenue, a person with money, investor, People, man & woman, personal spending increase, increase of an investment
This KPI Diagram Shown With Four Bar Charts and Key Values Description Template is a part of our Company Finance Data Charts PPT Template.


