Landscape Triangle Arrow Funnel 5 stages
from deck
Flat Infographic Templates Design Bundle (PPT diagrams and icons)
- Info
- How To Edit
- Usage example
Info
Landscape Triangle Arrow Funnel 5 Pieces
Slide Content
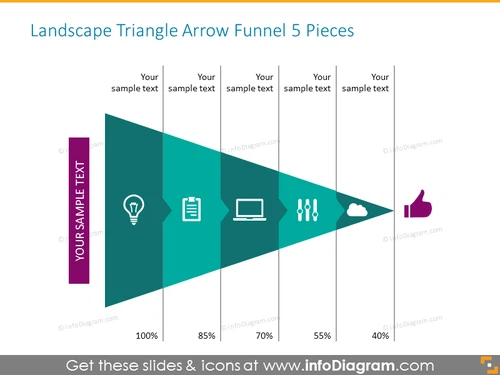
The slide is titled "Landscape Triangle Arrow Funnel 5 Pieces" and features a graphical representation of a funnel, segmented into five colored sections diminishing in size from left to right, symbolizing a process of filtering or selection. Each section is paired with a corresponding icon and placeholder text, which suggests customizing these to align with specific stages or elements of a process. The percentages below each segment imply a quantitative measure of this process, indicating stages of decline or refinement within the funnel.
- Lightbulb icon: Often represents an idea or the start of a concept.
- Document icon: Could symbolize the documentation or planning stage.
- Laptop icon: May represent the execution or operational phase.
- Hand icon with dots: Might depict interaction or engagement with the process.
- Cloud icon: Could indicate data storage or cloud computing aspects of the process.
- Thumb up icon: Is likely to symbolize approval, completion, or satisfaction.
Graphical Look
- The slide features a large central graphical element which is a teal-colored arrow shaped as a right-angled triangle, pointing towards the right.
- The triangle is segmented into five pieces with varying widths, starting from the widest on the left and narrowing down to the smallest on the right.
- Each segment contains a flat design white icon corresponding to a different abstract concept.
- Beneath the arrow, there are percentage values in bold black font indicating a descending scale from 100% to 40%.
- There is placeholder text above each segment in gray font color to be replaced with relevant content.
- Each segment of the funnel, as well as the area surrounding the icons and text, is bordered by lines in lighter shades creating a layered effect.
The visual design is clear and professional, using a gradient of color for visual interest. The funnel concept is effectively represented, with icons and text that invite customization for specific presentation needs.
Use Cases
- Sales and Marketing Presentations: To illustrate the stages of the customer journey, from initial awareness (100%) to conversion (40%), with each step representing a further point of engagement.
- Project Management and Development: Displaying the phases of a project lifecycle, helping stakeholders understand the progression from ideation to completion.
- Training and Education: To depict the filtering of concepts or learning objectives as participants progress through a training module or educational program.
- Data Analysis Reports: Visualizing the stages of data filtering or analysis, indicating the reduction of a data set through various criteria or operational stages.
How To Edit
How to edit text & colors

How to expand / shorten diagram

How to Replace Icons in infoDiagram PPT


