Financial Decks
Visualize your results with ease
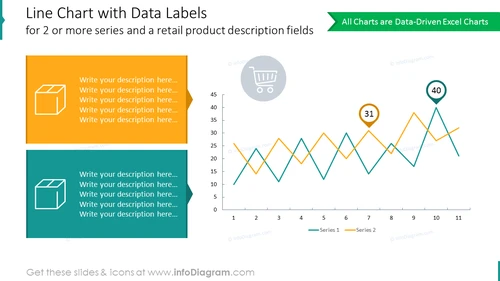
Line chart with data labels placing product description fields
from deck
Line Chart Data-driven Graphics (PPT Template)
Info
Line Chart With Data Labels Placing Product Description Fields Template
This is a 2 variables line chart presenting data against each other in one diagram. Use this Excel data-driven chart to mark critical achievements with colorful numeric markers and add specific descriptions to the text containers on the side. Compare data easily, thanks to the contrasting colors of the chart lines and slide graphics.
What Does This Line Chart With Data Labels Placing Product Description Fields Template Include?
- Editable Excel data-driven double-line chart for actual and forecast data
- Colorful numeric drop-shaped markers for highlighting specific points on the chart
- Colorful editable text containers for your descriptions
- Outline icons of a box, product, basket, sales, retail
This Line Chart With Data Labels Placing Product Description Fields Template is a part of our Line Chart Data-driven Graphics PPT Template.


