Financial Decks
Visualize your results with ease
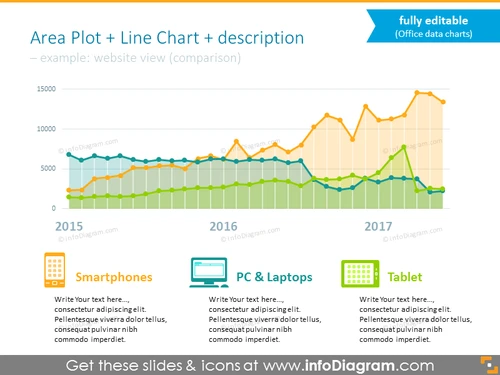
Line chart ppt template with plot area, description and markers
from deck
Flat Data-Driven Presentation Charts (PPT template)
Info
Line Chart PPT Template With Plot Area, Description and Markers Infographic
This colorful diagram presents results related to 3 devices: smartphones, PC & laptops, and tablets. You can present data covering over two years on our Excel data-driven transparent area plot combined with a linear chart that illustrates both the volume and the trend in an understandable way. Add your descriptions, and you are ready to go.
What Does This Line Chart PPT Template With Plot Area, Description and Markers Infographic Include?
- Excel data-driven area plot combined with a linear chart
- 3 editable text placeholders with titles for your descriptions
- Flat icons of a smartphone, computer, and tablet
This Line Chart PPT Template With Plot Area, Description and Markers Infographic is a part of our Flat Data-Driven Presentation Charts PPT Template.


