Financial Decks
Visualize your results with ease
Major recommendation graphics with creative bullet points description
from deck
Web Analytics Report Charts (PPT Template)
Info
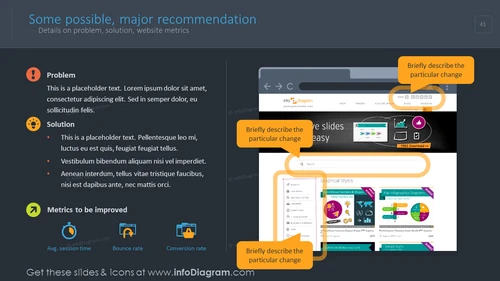
Some possible, major recommendation
— Details on problem, solution, website metrics
Slide Content
The slide is titled "Some possible, major recommendation" and discusses details on a problem, proposed solutions, and website metrics to be improved. Under "Problem," generic placeholder text is shown, implying an issue with website performance or experience. The "Solution" section lists strategies to tackle the problem, using three placeholder bullet points hinting at steps for improvement. "Metrics to be improved" introduces three indicators: average session time, bounce rate, and conversion rate—each representing key performance metrics for analyzing website effectiveness.
Graphical Look
- The slide has a dark grey background with a contrasting orange element at the top where the slide title is located.
- On the left side, there are three colored circular icons with graphics representing a problem (red), solutions (yellow), and metrics (green), followed by corresponding text sections with placeholder content.
- The right side features two images of a browser window with overlaid text boxes instructing to "Briefly describe the particular change".
- Each metrics icon on the left side (clock, graph, and cart) is related to the website metric it represents.
- The slide number "41" is in the upper right corner.
- The structure of the slide is two-column, with text on the left and images on the right.
The slide presents a professional, clean, and modern design using simple icons and color-coding to differentiate between various sections. The asymmetrical layout balances a dense text area on the left with more visual elements on the right.
Use Cases
- Presenting website optimization strategies to stakeholders to illustrate potential improvements in user engagement and conversion.
- Explaining to a design or marketing team the specific areas of a website that require updates or redesign, using the right side to point out visual changes.
- Using it in web analytics meetings to discuss key performance metrics and their roles in assessing website performance.
- Incorporating in a training session for web developers and content managers to understand the impact of various website features on overall performance and user experience.


