Financial Decks
Visualize your results with ease
Market share comparison statistics slide for 4 products
from deck
Pie and Donuts Chart Data-driven Graphics (PPT Template)
Info
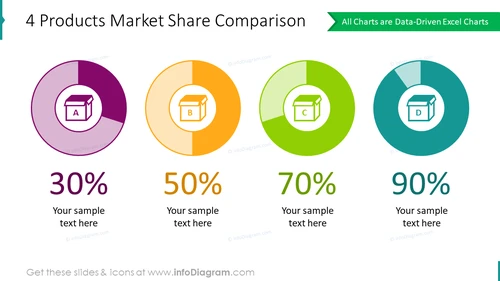
4 Products Market Share Comparison
Slide Content
The slide titled "4 Products Market Share Comparison" presents a visual comparison of market shares for four different products labeled A, B, C, and D. Each product is associated with a pie chart indicating its market share percentage: Product A has 30%, B has 50%, C has 70%, and D has 90%. Corresponding to these percentages, sample text placeholders allow for additional descriptions or insights regarding each product's performance. The pie charts provide a clear, comparative overview emphasizing the varying degrees of market dominance among the products.
Graphical Look
- The slide has four circular diagrams (pie charts) spread horizontally across the slide.
- Each chart is a different color: purple, orange, green, and teal, respectively, corresponding with Products A, B, C, and D.
- The charts are designed with a cut-out effect, showing a portion of the pie that represents the product's market share.
- Inside each chart, there is a white icon of a box with a corresponding letter (A, B, C, or D) that represents each of the four products.
- Large percentage figures (30%, 50%, 70%, and 90%) are centrally placed below each chart to indicate the market share visually represented by the pie chart.
- Beneath the percentages, there is a placeholder text "Your sample text here" for additional commentary.
The overall look of the slide is clean and modern with a straightforward layout. The use of bold colors and large fonts for percentages makes the information immediately accessible and easily understandable.
Use Cases
- To present a visual comparison of market shares for multiple products during business meetings or investor briefings.
- As part of a sales presentation to demonstrate the success or positioning of products relative to competitors.
- In a marketing strategy meeting to identify which products are dominating the market and which require more focus.
- During annual or quarterly business reviews to discuss the market performance and trends of the company's product portfolio.


