Financial Decks
Visualize your results with ease
Data transformation and segmentation
from deck
Data Science Big Data Analytics Icons (flat PPT clipart)
Info
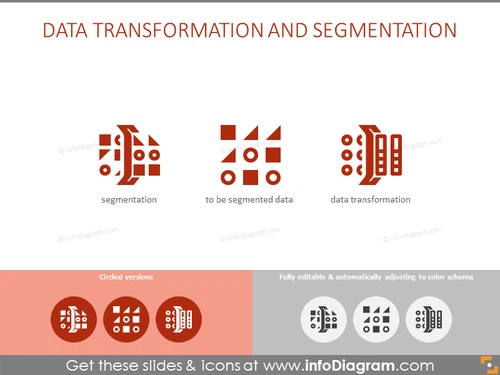
DATA TRANSFORMATION AND SEGMENTATION
Slide Content
The PowerPoint slide titled "DATA TRANSFORMATION AND SEGMENTATION" emphasis the integral concepts of processing data. 'Segmentation' refers to the division of data into smaller, relevant groups. 'To be segmented data' describes the prepared dataset that will undergo such division. 'Data transformation' denotes the processes that alter data formats or structures, often as preparation for analysis.
Graphical Look
- The slide is organized into two rows each containing different elements.
- The top row features three pairs of icons and associated text labels: "segmentation," "to be segmented data," and "data transformation."
- Each pair consists of a larger icon on the left and a smaller one on the right, representing different stages or aspects of the data process.
- The icons are a mix of geometric shapes like triangles, rectangles, and circles meant to symbolize segmented data and transformation processes.
- The bottom row displays the words "Circled versions" on the left and "Fully editable & automatically adjusting to color schema" on the right, with corresponding icon examples underneath.
- The slide uses a minimalistic color scheme primarily in shades of red, gray, and white against a light background.
The overall look of the slide is clean and modern, leveraging a simple color palette and icons to convey complex data processes visually. The design allows viewers to quickly grasp the concepts through straightforward graphical representations.
Use Cases
- To explain the steps of data processing during internal team meetings or training sessions.
- In a pitch to potential clients showcasing the expertise in data handling, segmentation, and transformation services.
- Within educational settings, as part of a lecture or course material on data science or analytics.
- As a visual aid in a webinar or online course about data management techniques.


