Financial Decks
Visualize your results with ease
Modify all charts shapes
from deck
Line Chart Data-driven Graphics (PPT Template)
Info
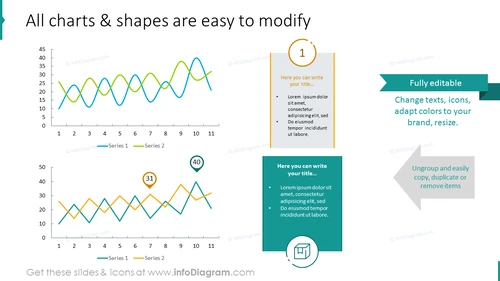
All charts & shapes are easy to modify
Slide Content
The PowerPoint slide presents the concept of easily modifiable charts and shapes within a presentation. It features two line graphs comparing 'Series 1' and 'Series 2' data sets against an 11-point horizontal axis, suggesting a dynamic comparison of trends or metrics. These graphs are accompanied by three blocks of text emphasizing the customizability of the presentation elements. These blocks suggest that users can modify titles, adapt colors and styles to match branding, and manipulate the layout by copying, duplicating, or removing items—all illustrating the flexibility of the slide design elements.
Graphical Look
- Two line graphs at the top and bottom of the slide, both with blue and green lines, legends, and numerical labels on the axes.
- A gold circular icon with the number "1" at the top right, adjacent to a text box with a placeholder title and bullet points.
- A green banner label in the top right corner with the text "Fully editable."
- A blue square icon with the number "31" and a green drop-shaped icon with the number "40" appear to be annotations on the graphs.
- A bottom right square with a monitor icon and an arrow, next to a text box mirroring the top right one.
- Teal arrow labels pointing to the right, each with instructional text explaining the slide's features.
The overall look of the slide is clean and professional, with a well-organized layout that strategically uses color and icons to visually separate different content areas and functionalities.
Use Cases
- To demonstrate in a sales pitch how a product or service can help clients easily visualize and manipulate data.
- In a training session, to instruct users on how to customize their own presentations using the software's features.
- During a marketing presentation, to showcase how branding can be incorporated into various graphic elements.
- In a project management meeting, when illustrating how different aspects of a report can be tailored to audience preferences or specific project needs.


