Financial Decks
Visualize your results with ease
multicolor circle detailed diagram slide
from deck
Infographics diagrams and symbols - flat PPT clipart
Info
Your sample text
Slide Content
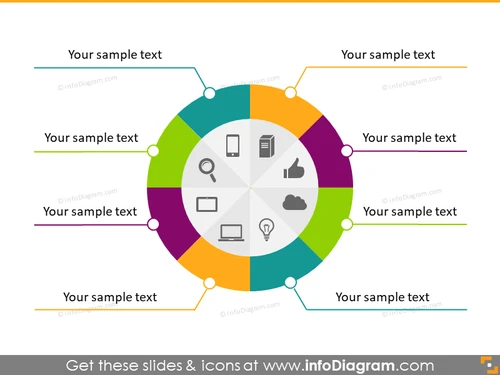
The PowerPoint slide presents a circular diagram dividing into six colored segments, each with a unique icon and connected to an external text placeholder. The icons represent different concepts: a magnifying glass suggests analysis or search, a thumbs-up denotes approval or success, a cloud symbolizes technology or cloud computing, a laptop indicates work or computing, a lightbulb for ideas or innovation, and gears imply processes or mechanics. These visual elements serve to convey key aspects or departments of a project or organization which can be described in the adjacent text placeholders.
Graphical Look
- A central circle divided into six colored segments.
- Each segment contains a white icon in the center.
- Six lines extend outward from the central circle to text boxes with placeholder text.
- The text boxes are aligned horizontally and vertically around the diagram.
- Each text box is connected to its respective segment with a circle and a line.
- The colors of the segments are distinct and include shades of green, violet, orange, blue, gray, and teal.
- The icons within the segments are simple and universally recognizable symbols.
The slide is visually balanced with a symmetrical arrangement centered around the circular diagram. The color scheme is vibrant and diverse, which aids in distinguishing different sections and creating visual interest.
Use Cases
- Presenting a business model or framework with various interconnected components.
- Explaining the different departments and their functions within an organization.
- Illustrating the stages of a project or process and their key objectives.
- Summarizing the aspects of a product offering or service in a visually engaging way.


