Financial Decks
Visualize your results with ease
Performance indexes comparison gauges charts
from deck
Gauge Charts for KPI Dashboards (PPT Template)
Info
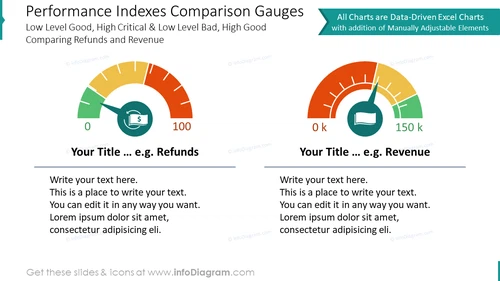
Performance Indexes Comparison Gauges
Slide Content
The slide illustrates two performance gauges that compare different metrics, indicating 'Refunds' and 'Revenue' as examples. The left gauge presents a green to red gradient suggesting that low levels are good and high levels are critical, which is typically applied to measures where a lower figure is preferred, like a refund or error rate. The right gauge inversely represents a metric where high figures are favorable, as it's color-coded green in the higher end, suitable for KPIs like revenue or sales volume. Placeholder text below each gauge suggests areas for customization.
Graphical Look
- Two semi-circle gauge charts dominate the slide, side by side, one on the left and one on the right.
- Each gauge has a colored gradient: the left one transitions from green to red and the right one from red to green.
- A needle on each gauge points towards a value, indicating a measurement.
- Placeholder texts "Your Title ... e.g., Refunds" and "Your Title ... e.g., Revenue" are present above each gauge.
- Below each gauge, there is a text box with placeholder lines for additional detail or description.
The slide features a bold, clean design with a good balance of graphics and text. The contrasting colors draw attention to the gauges, which are the focal point.
Use Cases
- Showcasing key performance indicators (KPIs) during business presentations.
- Visual comparison of targets versus actual results in team meetings or reports.
- Discussing efficiency and performance in sectors like customer service or sales in management reviews.
- Demonstrating financial metrics such as revenue growth or cost reduction strategies in company-wide assemblies.


