Financial Decks
Visualize your results with ease
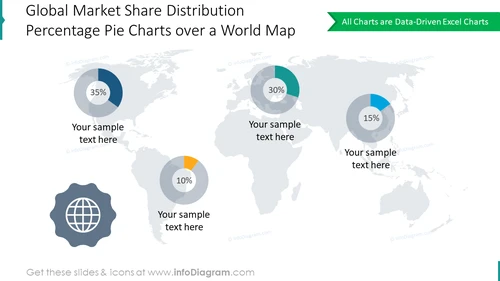
Pie graphics showing global market share distribution over the world
from deck
Pie and Donuts Chart Data-driven Graphics (PPT Template)
Info
Pie Graphics Showing Global Market Share Distribution Over the World Infographic
This Universal world map graphic serves as a background for multiple percentage pie charts with descriptions. Use it to illustrate the global market share distribution. Color code your localizations, add or remove charts from the map and adjust their size to your needs. All diagrams are Excel data-driven and can be modified fast.
What Does This Pie Graphics Showing Global Market Share Distribution Over the World Infographic Include?
- Gray world map graphic in the background
- 4 editable Excel data-driven pie charts with descriptions
- Darg gray badge-shaped graphic containing an outline icon of a globe
This Pie Graphics Showing Global Market Share Distribution Over the World Infographic is a part of our Pie and Donuts Chart Data-driven Graphics PPT Template.


